Oxygen vacancies often determine the electronic structure of metal oxides, but existing techniques cannot distinguish the oxygen-vacancy sites in the crystal structure. We report here that time-resolved optical spectroscopy can solve this challenge and determine the spatial locations of oxygen vacancies. Using tungsten oxides as examples, we identified the true oxygen-vacancy sites in WO2.9 and WO2.72, typical derivatives of WO3 and determined their fingerprint optoelectronic features. We find that a metastable band with a three-stage evolution dynamics of the excited states is present in WO2.9 but is absent in WO2.72. By comparison with model bandstructure calculations, this enables determination of the most closely neighbored oxygen-vacancy pairs in the crystal structure of WO2.72, for which two oxygen vacancies are ortho-positioned to a single W atom as a sole configuration among all O-W bonds. These findings verify the existence of preference rules of oxygen vacancies in metal oxides.
Publication: https://www.science.org/doi/10.1126/sciadv.aax9427
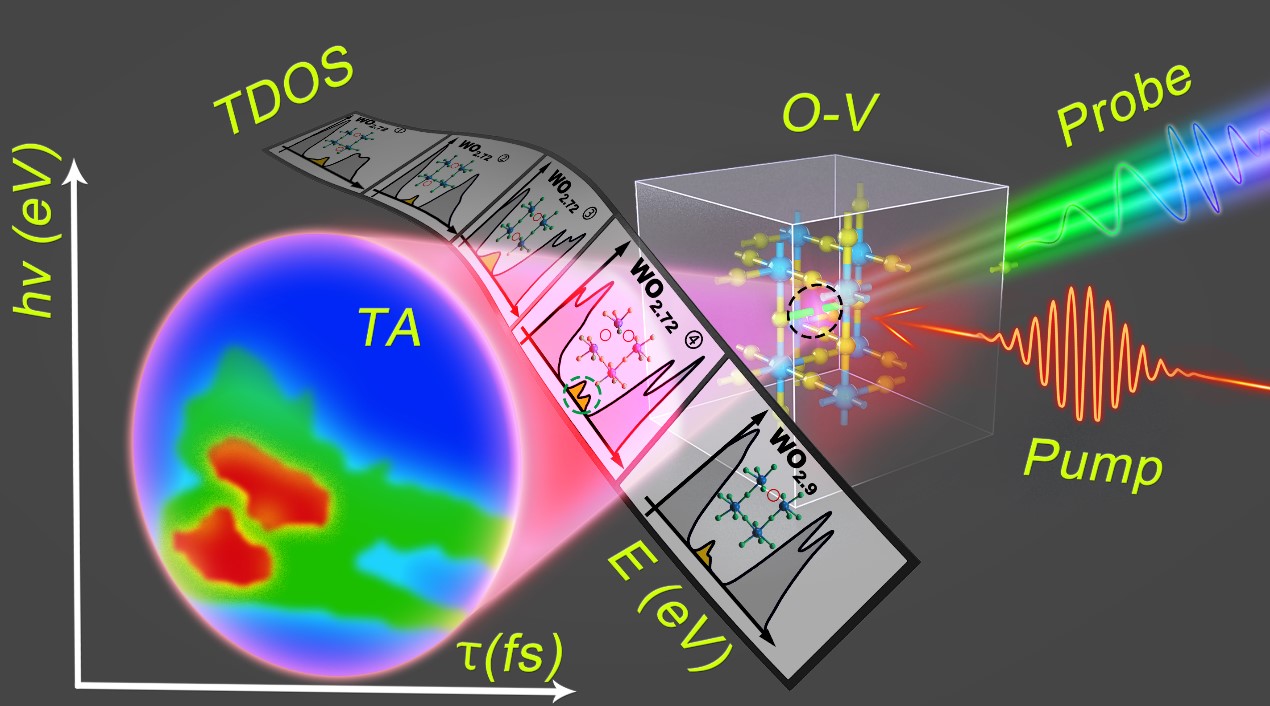
Fig. 1 Schematic illustration of the fsV principles.
Femtosecond laser pulses (pump) excite the oxygen vacancy (O-V)–contained metal oxides. Interaction of broadband supercontinuum pulses (probe) with the excited states characteristic of the oxygen vacancies induces a spectroscopic picture of TA as a function of photon energy (hν) and time delay (τ). Alignment of TA (hν, τ) with the distribution of the TDOS with photon energy E enables precise determination of the unique oxygen-vacancy arrangement for a given metal oxide. The slides present schematically the varied chemical structures and TDOS spectra for different O-V configurations of WO2.9 and WO2.72. The black dashed circle highlights a schematic O-V site. The dashed green ring on one of the slides highlights the defect state plotted as TDOS spectrum calculated on a specific O-V structure in WO2.72. The correlation between the tentative O-V structures, the TDOS spectra, and the measured TA dynamics enables determination of the true O-V configuration through precise matching between the TDOS and TA performance.
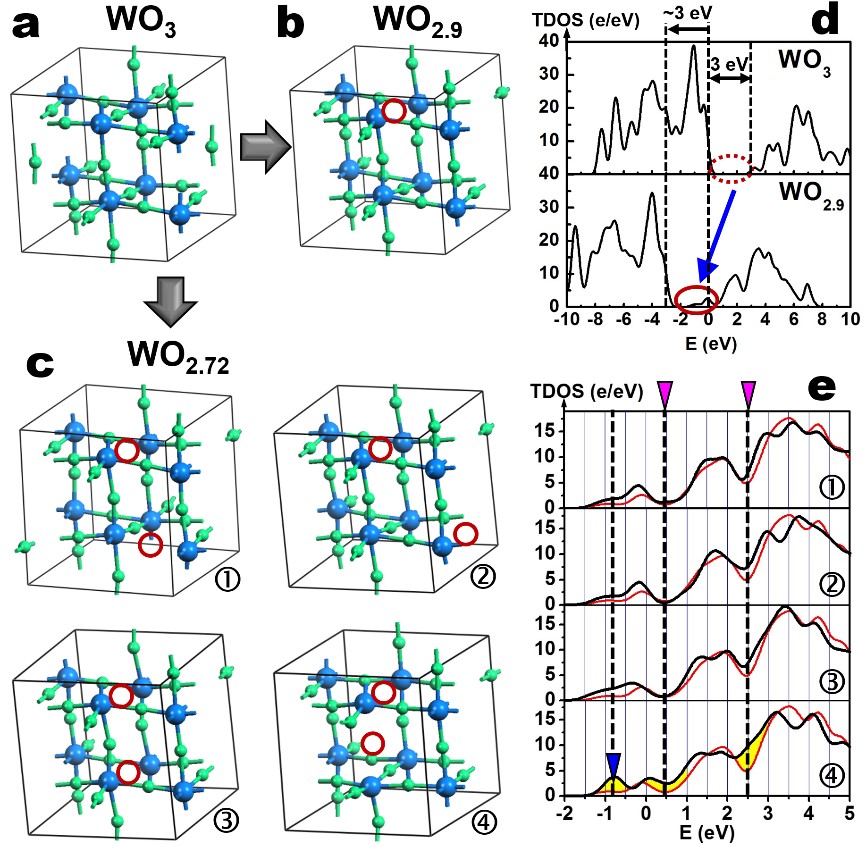
Fig. 2 Crystal structure models and TDOS calculation results.
Local structural configurations of (A) WO3, (B) WO2.9, (C) WO2.72 and the corresponding TDOS distributions for (D) WO3 (top)/WO 2.9 (bottom) and ( E) WO2.72 (①, ②, ③, and ④).
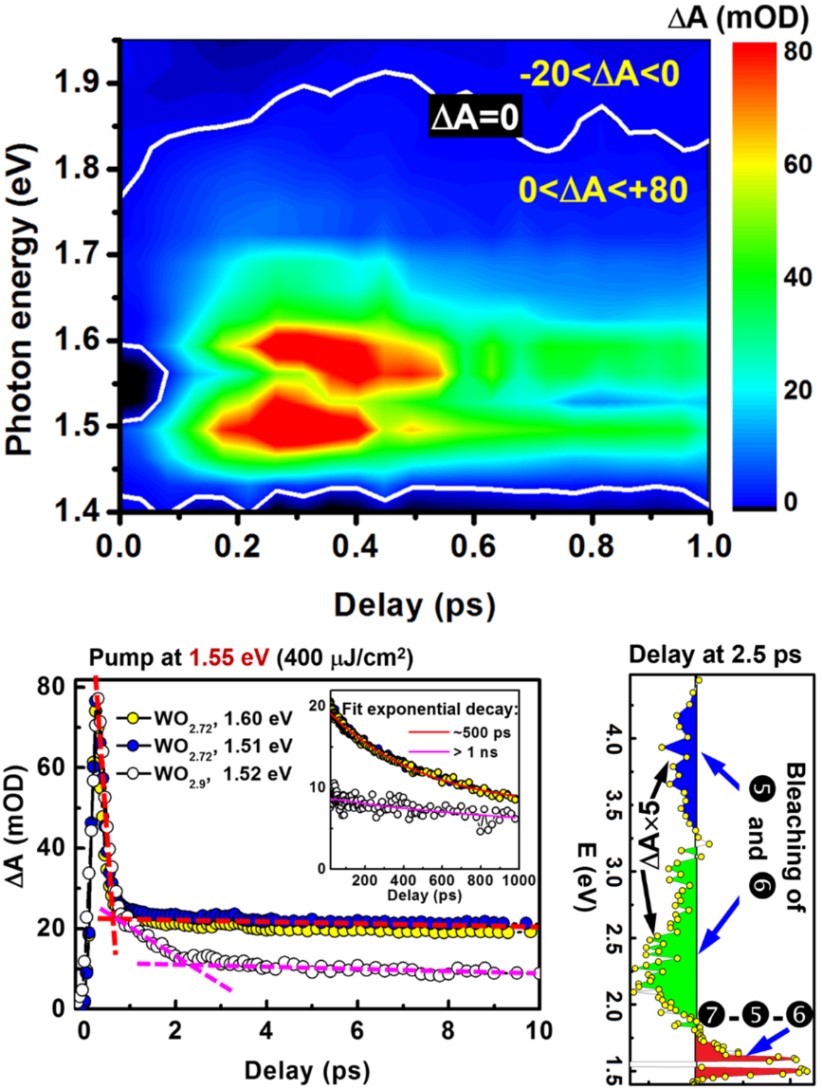
Fig. 3 TA spectroscopic measurements on WO2.72 with pumping at 1.55 eV.
(A) TA as a function of time delay and probe photon energy. (B) TA dynamics measured for WO2.72 at 1.51 and 1.60 eV and WO2.9 at 1.52 eV for a delay time range of 0 to 10 ps, using a pump fluence of 400 μJ/cm2. Inset: TA dynamics in a delay time range of 20 to 1000 ps. (C) The TA spectrum at a delay of 2.5 ps between the pump and probe pulses, resolving the two energy bands I and II that include E0 and ED, respectively.
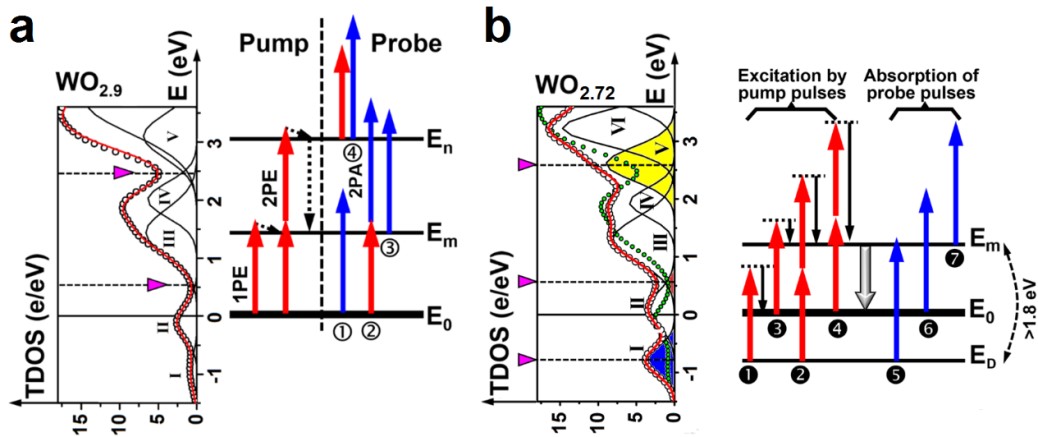
Fig. 4 Calculated TDOS for WO2.72, WO9 and the fit obtained by decomposing the band distribution into multiple subbands.
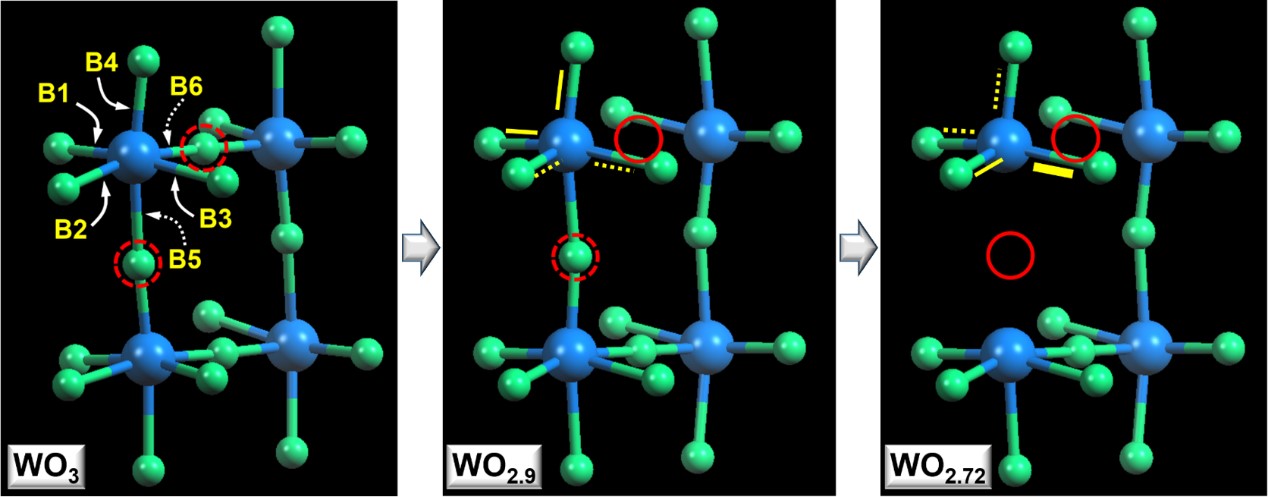
Fig. 5 Chemical bond configurations for WO3, WO2.9, and WO2.72 with different oxygen-vacancy distributions.
Dashed arrows indicate weakest bonds (B5 and B6), according to the theoretical calculations.