Transgranular brittle fracture is the dominant failure mode of brittle materials, including ceramics and ceramic matrix composites. However, strengthening these materials without sacrificing their toughness has been a big challenge. In this study, an innovative approach is proposed to achieve coordinated strengthening and toughening of ceramics-based composites by introducing specific ductile coherent nanoparticles into ceramic grains. As an example, the WC–Co cemented tungsten carbides were used to demonstrate how this brittle material can achieve ultrahigh strength without losing toughness by seeding metallic nanoparticles inside WC grains. The mechanisms for inducing the formation and modulating the amount, size, and distribution of such nanophase within the ceramic grains were disclosed. The fraction of transgranular ruptures of the brittle ceramic phase was reduced significantly due to the presence of the ductile coherent in-grain nanoparticles. Both the strength and strain limit of the cemented carbides were remarkably increased compared to their counterparts reported in the literature. The coordinated strengthening and toughening strategy proposed in this work is applicable to a broad range of ceramics and ceramic matrix composites to obtain superior comprehensive mechanical properties.
Publication:https://doi.org/10.1039/D3MH02233A
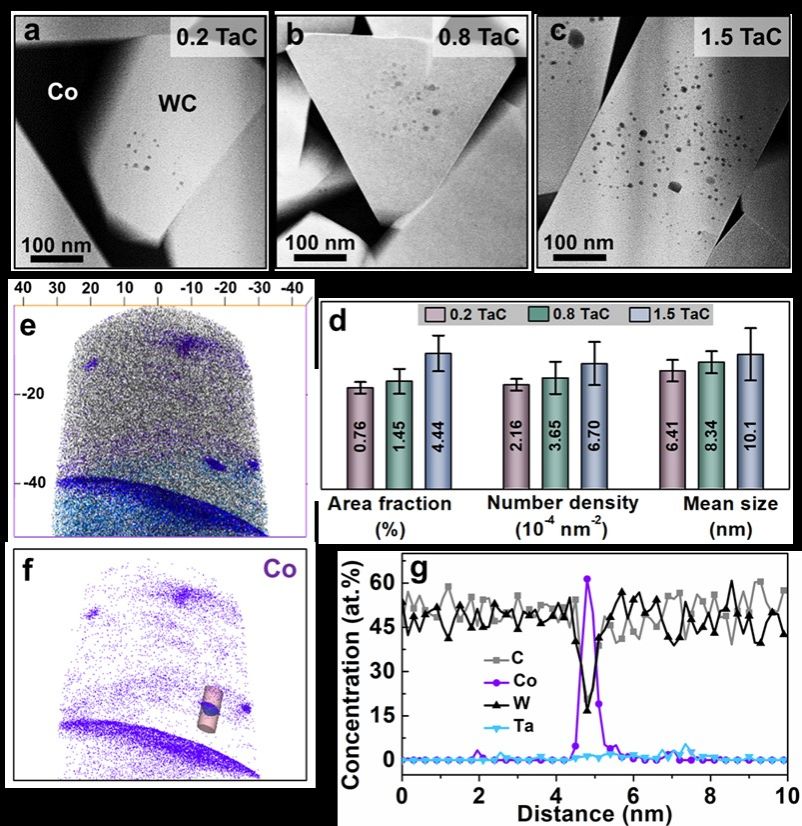
Fig. 1
Nanoparticles in the ceramic phase of the samples prepared by the in situ synthesized WC–Co composite powder mixed with nanoscale TaC powder, and the composition analysis by APT for these nanoparticles using the WC-10Co-0.8TaC sample as an example. (a)–(c) HAADF-STEM images showing nanoparticles inside WC grains in the samples with different contents of nanoscale TaC addition. (d) Statistical counting of the mean size, number density and area fraction of the nanoparticles. (e) 3D atomic maps of all the elements: W (black), Ta (blue), Co (purple), and C (grey). (f) Elemental map of Co atoms. (g) Proximity histogram showing composition changes across an isolated nanoparticle, corresponding to the region marked by a cylinder in (f).
。
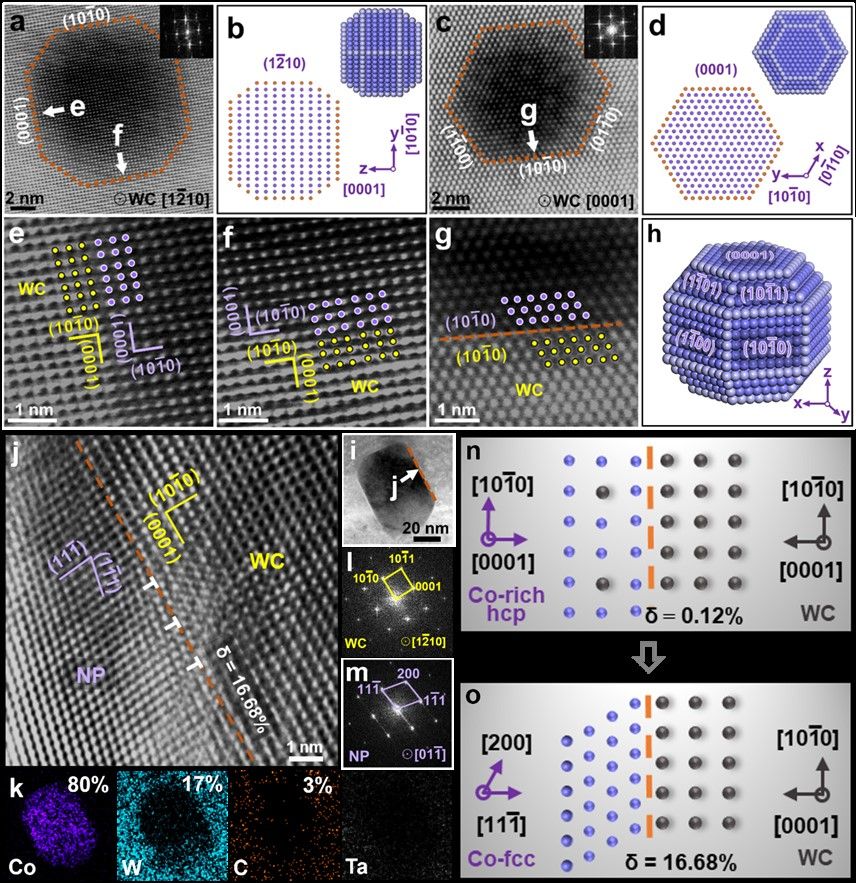
Fig. 2 Crystallographic characteristics of the in-grain nanophase with small sizes in the WC-10Co-0.8TaC sample (a)–(h) and large sizes in the WC-10Co-1.5TaC sample (i)–(m). (a) HAADF-STEM image of a nanoparticle, with the FFT pattern indicating the observation direction ([1![[2 with combining macron]](https://www.rsc.org/images/entities/char_0032_0304.gif) 10]WC) and crystal planes. (b) Schematic diagrams of the cross-sectional and projection atomic arrangements of the particle in (a) on the (110) plane, with inner, boundary and edge atoms in purple, orange and gray, respectively. (c) Another representative image of the nanoparticle viewed along [0001]WC. (d) Cross-sectional and projection atomic arrangements corresponding to the particle in (c) on the (0001) plane. (e)–(g) High-resolution images revealing the coherent interfaces between the nanoparticle and the WC matrix, corresponding to the regions indicated by arrows in (a) and (c). (h) Schematic diagram for a three-dimensional geometry of the nanoparticle. (i) HAADF-STEM image of a large nanoparticle. (j) Structure of the interface between the nanoparticle (NP) and WC, corresponding to the region marked in i, with “T” indicating dislocations at the interface. (k) EDS analysis of the large nanoparticle in (i). (l) and (m) FFT patterns of WC and NP corresponding to regions in (j). (n) and (o) Schematic diagrams for the evolution in the crystallography of the NP/WC interface with the particle size from the coherent (n) to semi-coherent (o).
10]WC) and crystal planes. (b) Schematic diagrams of the cross-sectional and projection atomic arrangements of the particle in (a) on the (110) plane, with inner, boundary and edge atoms in purple, orange and gray, respectively. (c) Another representative image of the nanoparticle viewed along [0001]WC. (d) Cross-sectional and projection atomic arrangements corresponding to the particle in (c) on the (0001) plane. (e)–(g) High-resolution images revealing the coherent interfaces between the nanoparticle and the WC matrix, corresponding to the regions indicated by arrows in (a) and (c). (h) Schematic diagram for a three-dimensional geometry of the nanoparticle. (i) HAADF-STEM image of a large nanoparticle. (j) Structure of the interface between the nanoparticle (NP) and WC, corresponding to the region marked in i, with “T” indicating dislocations at the interface. (k) EDS analysis of the large nanoparticle in (i). (l) and (m) FFT patterns of WC and NP corresponding to regions in (j). (n) and (o) Schematic diagrams for the evolution in the crystallography of the NP/WC interface with the particle size from the coherent (n) to semi-coherent (o).
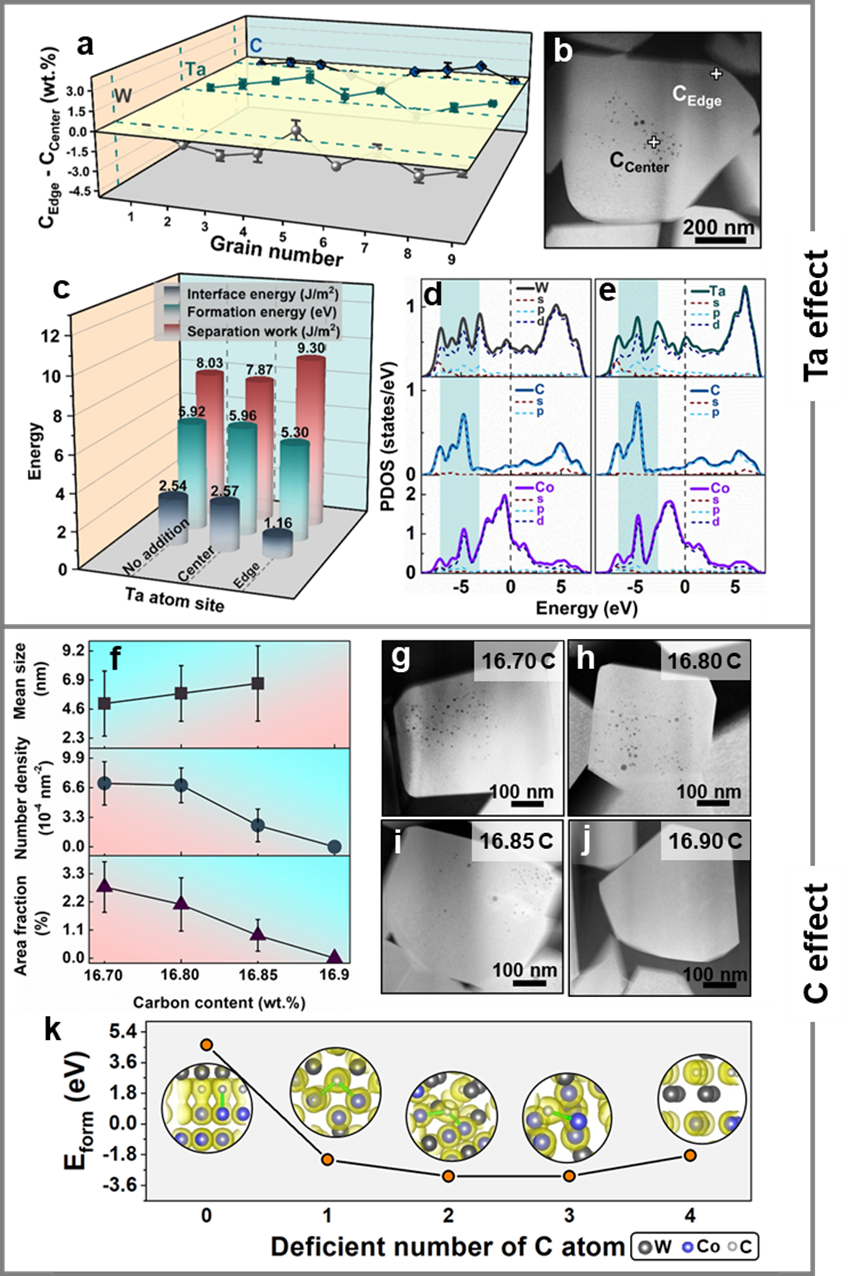
Fig. 3 Analyses from experiments and first-principles calculations regarding the effects of TaC addition and carbon content in the WC–Co composite powder on the formation of Co-rich in-grain nanophase. (a) Differences of W, C and Ta concentrations between the center and edge regions of WC grains, measured by EDS-STEM point scans. (b) Image showing regions for composition detection, where measurements were performed for three times at each point to minimize error. (c) Calculated formation energy, interface energy and separation work of WC/Co interfaces with different Ta occupation. (d) and (e) PDOS of atoms at WC/Co interfaces without and with Ta, respectively. (f) Statistical counting of the mean size, number density and area fraction of the in-grain nanophase in samples with different carbon contents. (g)–(j) Images showing in-grain nanophase distributions in the samples with carbon contents of 16.70, 16.80, 16.85 and 16.90 wt% in the composite powders, respectively. (k) Calculated formation energy of the in-grain nanophase at different states of carbon deficiency, with the insets showing the charge distributions across the in-grain nanophase/WC interface with different numbers of deficient C atom. The computation models corresponding to (c)–(e) are given in Fig. S2 (ESI†), and those corresponding to (k) are given in Fig. S3 and S4 (ESI†), respectively.
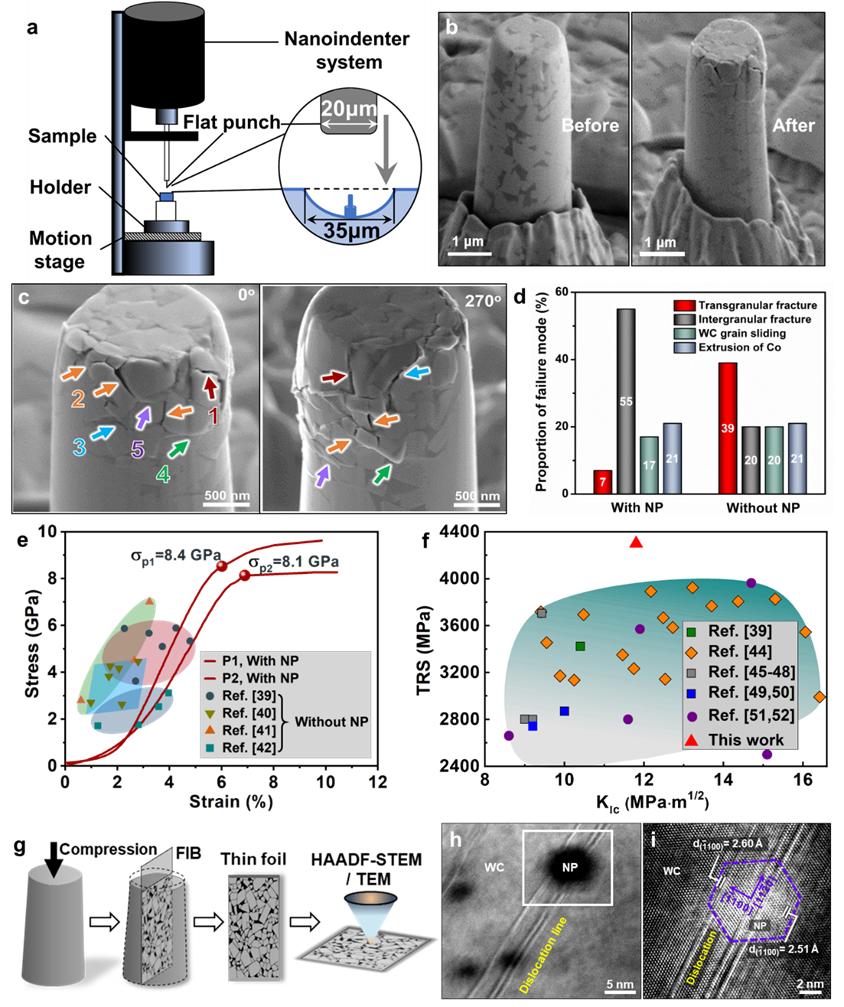
Fig. 4 Effect of the ductile in-grain nanophase on the mechanical behavior of cemented carbide. (a) Schematic diagram of the micropillar compression assembly, with the inset displaying the local configuration of the punch and sample. (b) SEM images of the micropillar fabricated from the cemented carbide samples before and after compression tests. (c) SEM micrographs showing the deformation and failure modes during uniaxial compression of the micropillar with the in-grain nanophase, with the arrows in different colors indicating: “1” – transgranular fracture, “2” – intergranular fracture, “3” – WC/Co interfacial fracture, “4” – WC grain gliding, and “5” – extrusion of the Co binder. (d) Statistical analysis of failure modes of the micropillars with and without in-grain nanophase in WC grains. (e) Stress–strain curves of the micropillars with the in-grain nanophase (NP), and comparison of their yield strength with those of the cemented carbides with the same Co content in the literature (without NP). (f) Comparison of the macroscopic fracture strength and toughness between the sample with NP and its counterparts reported in the literature (without NP). (g) Schematic diagram of the sampling for the postmortem microstructure characterization of the micropillar after compression. (h) Image showing WC dislocations cutting through the in-grain nanophase. (i) HRTEM image corresponding to the rectangle in (h), showing the WC dislocations cutting through an individual nanophase, indicated by a dashed hexagonal.