Simultaneous improvement of strength and conductivity is urgently demanded but challenging for bimetallic materials. Here we show by creating a self-assembled lamellar (SAL) architecture in W-Cu system, enhancement in strength and electrical conductivity is able to be achieved at the same time. The SAL architecture features alternately stacked Cu layers and W lamellae containing high-density dislocations. This unique layout not only enables predominant stress partitioning in the W phase, but also promotes hetero-deformation induced strengthening. In addition, the SAL architecture possesses strong crack-buffering effect and damage tolerance. Meanwhile, it provides continuous conducting channels for electrons and reduces interface scattering. As a result, a yield strength that doubles the value of the counterpart, an increased electrical conductivity, and a large plasticity were achieved simultaneously in the SAL W-Cu composite. This study proposes a flexible strategy of architecture design and an effective method for manufacturing bimetallic composites with excellent integrated properties.
Publication:
https://www.nature.com/articles/s41467-024-46029-w
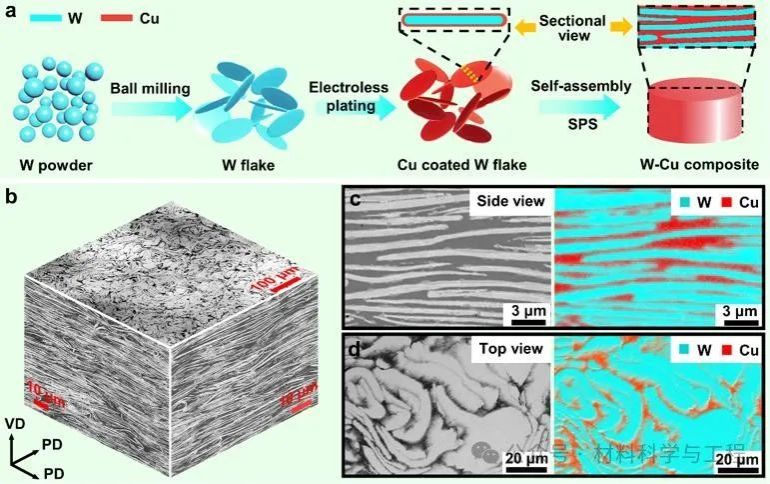
Fig. 1: Fabrication strategy and meso-structures of the SAL W-Cu composite. a Schematic diagram of the design strategy for the SAL W-Cu. b Three-dimensional reconstructed BSE micrograph of the prepared SAL W-Cu. c, d Enlarged cross-sectional c and top-view d BSE images of the SAL W-Cu and the corresponding elemental distribution.
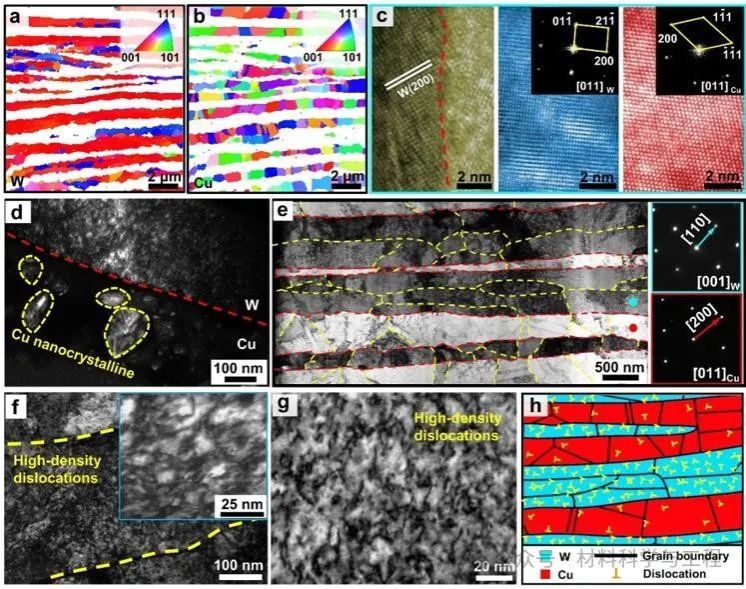
Fig. 2: Cross-sectional microstructures of SAL W-Cu composite and electrolessly plated W-Cu. a EBSD IPF map of W phase in the as-prepared SAL W-Cu. Inset: map color legend projected on the plane vertical to VD, showing a texture of <100 > W // VD. b EBSD IPF map of Cu phase in the as-prepared SAL W-Cu. Inset: map color legend projected on the plane vertical to VD. c HRTEM image of the interface in SAL W-Cu. Insets: the corresponding FFT patterns. d Dark field TEM image showing the nanocrystalline Cu in the electrolessly plated W-Cu. e Bright field TEM image showing the elongated W grains in the SAL W-Cu. Insets: the selected area electron diffraction (SAED) patterns and indexing with the zone axes of [001]W and [011]Cu, respectively. The red and yellow dashed lines represent phase boundaries and grain boundaries. f Bright field TEM image of the milled W flake containing dislocations. Inset: an enlarged view. g Bright field TEM image of W phase in SAL W-Cu, showing high-density dislocations. h Schematic sketch of the SAL architecture in the as-prepared W-Cu composite.
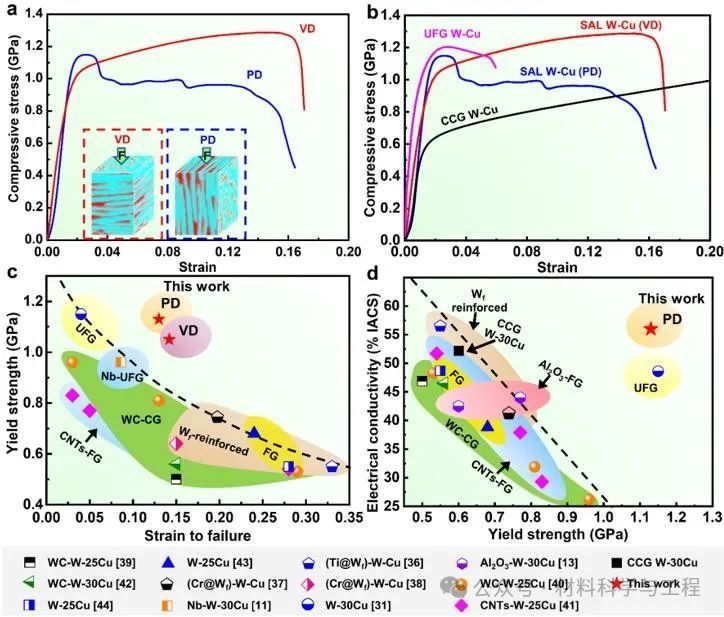
Fig. 3: Mechanical properties and electrical conductivity of the as-prepared SAL W-Cu at room temperature. a Compressive stress-strain curves of SAL W-Cu loaded along VD and PD. b Comparison of the compressive curves of SAL W-Cu and other W-Cu composites with a same composition but different grain sizes. c Compressive yield strength versus plastic strain of SAL W-Cu and comparison with those of other W-Cu composites. d Electrical conductivity versus compressive yield strength of SAL W-Cu and comparison with those of other W-Cu composites. The counterparts include W fiber (Wf) reinforced W-Cu, second-phase enhanced W-Cu, metal-doped W-Cu, fine-grained (FG) and ultrafine-grained (UFG) W-Cu.
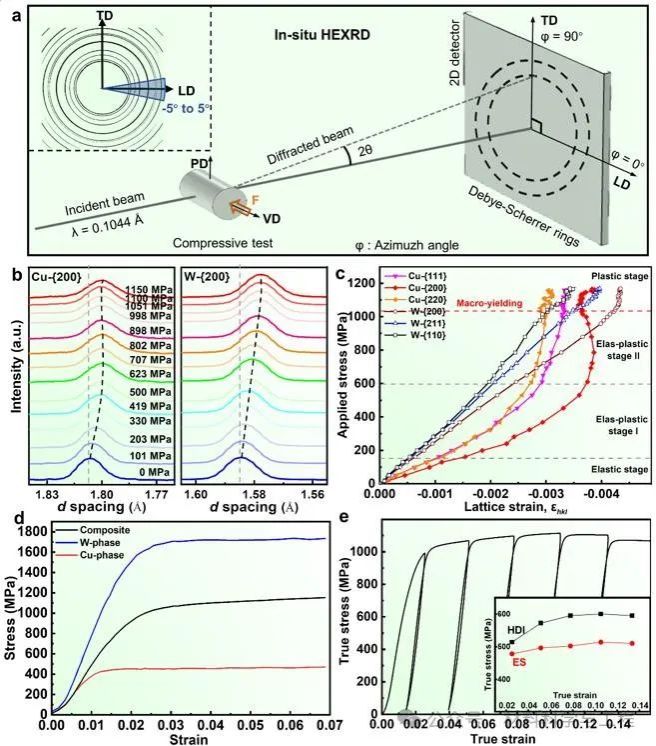
Fig. 4: Lattice strains and HDI stress evolution during uniaxial compression along VD. a Schematic diagram for the setup of in-situ HEXRD compression test. Inset: the azimuth angles in the Debye rings. b The corresponding diffraction patterns of {200}Cu and {200}W at various stress levels along VD according to the in-situ HEXRD results. c Evolution of lattice strain versus macroscopic stress for W ({200}W, {211}W, and {110}W) and Cu ({111}Cu, {200}Cu, and {220}Cu) planes along the loading direction. The macroscopic yield strength is marked by the red dashed line. d Calculated stress partitioning in W and Cu phases according to the HEXRD results. e LUR behavior of the SAL W-Cu along VD. Inset: HDI stress and effective stress (ES) evolution with plastic strain of the SAL W-Cu.
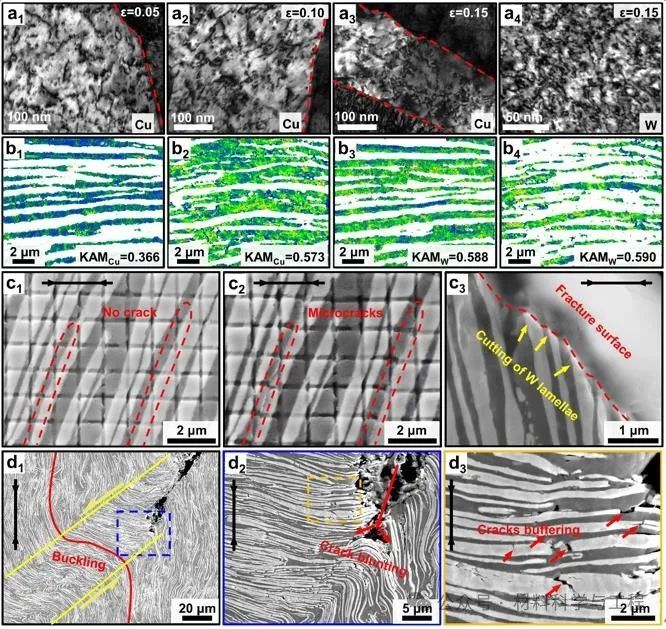
Fig. 5: Microstructure evolution during the compression of SAL W-Cu composite. a1-a3 Bright-field TEM images showing the evolution of dislocation density in Cu phase with the compressive strain (loading along VD). a4 Bright-field TEM image of the W phase with a compressive strain of 0.15 (loading along VD), revealing the high-density dislocations. b Kernel average misorientation (KAM) distributions of Cu (b1, b2) and W (b3, b4) phases in the as-prepared composite (b1, b3) and the fractured composite (b2, b4) with loading along VD. c1, c2 SEM images of the composite compressed along VD with a displacement of 0.60 m m and 0.68 mm, showing the appearance of microcracks in the marked regions. c3 Cross-sectional morphology of the fracture surface (loading along VD), showing the cutting of W lamellae. d1-d3 SEM images of the composite compressed along PD, where d1 shows the buckling of W lamellae after the stress drop, d2 is the enlarged view of the selected area in d1, showing the crack blunting, and d3 is the enlarged view of the selected area in d2, showing the cracks buffering in the W lamellae in the kinking band. The black arrows indicate the compression direction.