The immiscible bimetallic composites play an important role in civilian industries and aerospace fields owing to their integrated mechanical and physical properties. However, metallic composites of immiscible constituents suffer from one critical drawback of weak interface bonding, which makes the composites particularly vulnerable at elevated service temperatures. Here we proposed a novel strategy to resolve the challenge by creating low-energy phase interfaces in a typical immiscible bimetallic W–Cu composite. This was achieved by in-situ reactions of WO3 and CuO with WC, which acts in a dual function as the reducing agent for the reactions and an interface forming agent. The sintered W-WC-Cu composite possessed a significant number of low-energy WC/W and WC/Cu interfaces and exhibited a compressive strength of 609 MPa and a compressive ductility of 22.6 % at 600 °C, which ranks among the highest in similar composites. The characteristics of WC/W and WC/Cu interfaces and their effects on the mechanical behavior of the composite were demonstrated by the timely and atomic-resolved high-temperature mechanical investigations. The introduced stable interfaces were also found to induce [-111]BCC→[011]FCC phase transformation of W as another mechanism of plastic deformation in addition to dislocation activities in W and Cu. This study provides a new approach to greatly enhance the mechanical properties of the immiscible metallic composites.
Publication:https://doi.org/10.1016/j.compositesb.2024.111520
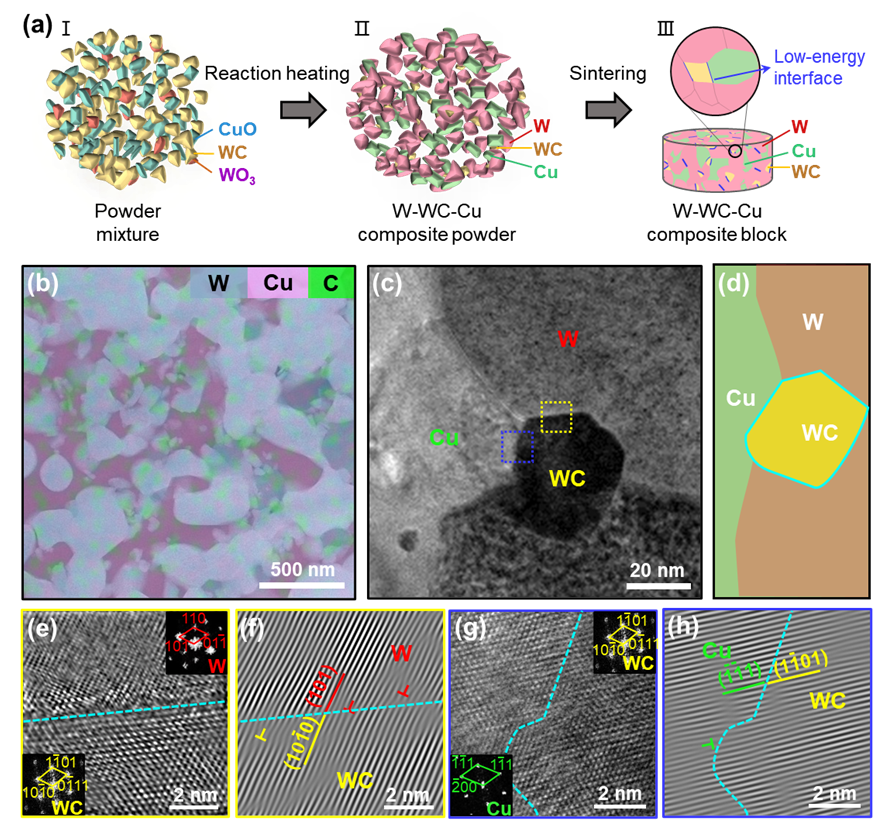
Fig. 1. Preparation and characterization of the W-WC-Cu composite. (a) Schematic of the fabrication process of the composite. (b) HAADF-STEM image of the microstructure of the sintered composite superimposed with super-EDS element mapping. (c) Bright-field TEM image of the sintered composite. (d) A schematic of the low-energy WC/W and WC/Cu interfaces (the blue lines) formed during the in-situ reaction process. (e) HRTEM image at a higher magnification of the yellow square region identified in (c) crossing a WC/W interface. The inset images are FFT patterns corresponding to the two regions across the interface. (f) IFFT image of the HRTEM image shown in (e). (g) HRTEM image of the blue square region in (c) crossing a WC-Cu interface. The inset images are FFT patterns corresponding to the two regions across the interface. (h) IFFT image of the HRTEM image shown in (g). (For interpretation of the references to color in this figure legend, the reader is referred to the Web version of this article.)
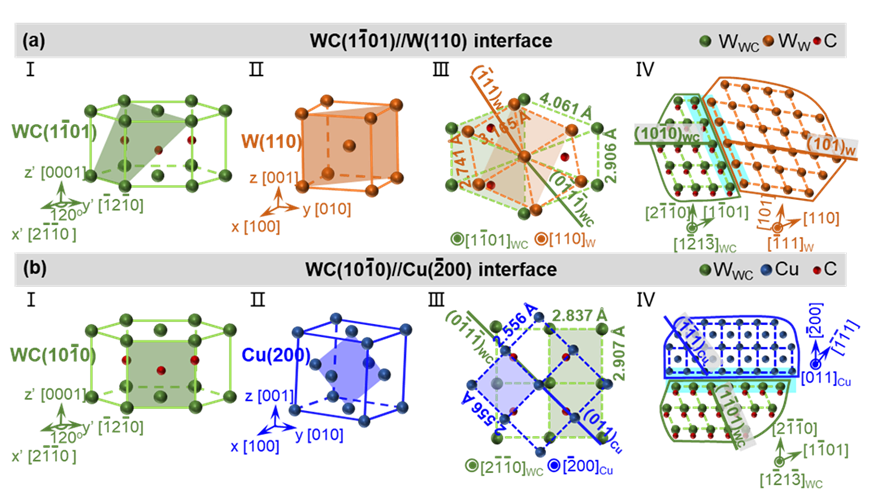
Fig. 2. Schematic illustrations of the WC/W and WC/Cu interfaces.
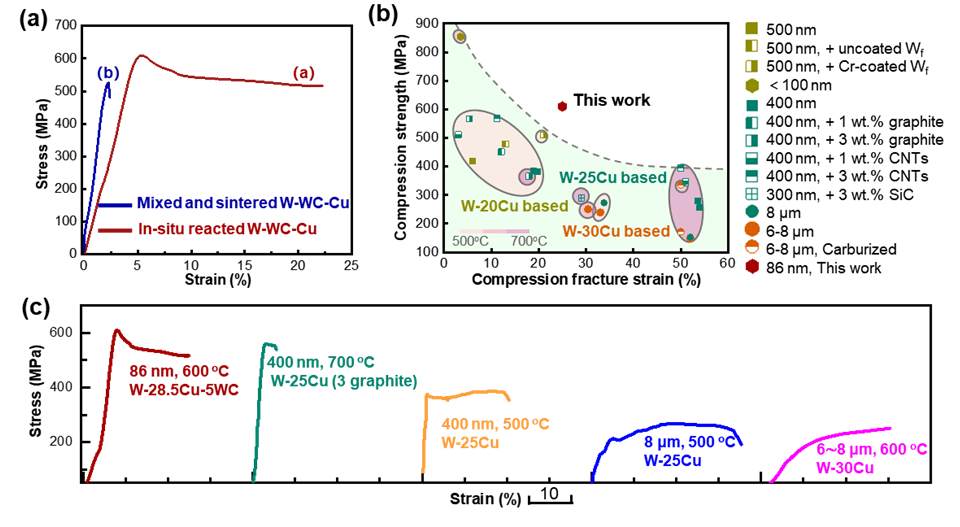
Fig. 3. High-temperature mechanical performance of the W-WC-Cu composite. (a) Compressive stress-strain curves of an in-situ reacted and sintered W-WC-Cu composite sample and a directly mixed and sintered W-WC-Cu composite sample at 600 °C. (b) Comparison of the compressive strength and ductility of the in-situ W-WC-Cu composite and other W–Cu based composites at 500–700 °C, together with those of the W–30Cu composite prepared by traditional infiltration method and W–20Cu composite prepared by high-energy ball milling and sintering. The size numbers for each composite in the legends indicate the grain sizes of the samples. (c) Compressive stress-strain curves of the in-situ W-WC-Cu composite and several other W–Cu based composites presented in (b).
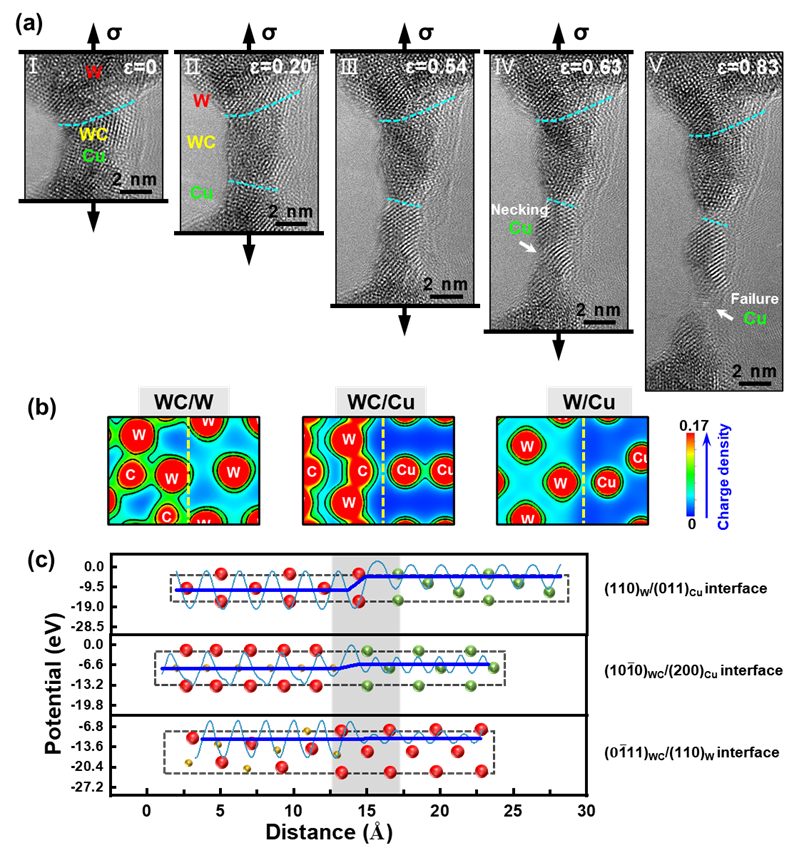
Fig. 4. Atomic-scale in-situ observation of the tensile deformation process of the nanostructured in-situ W-WC-Cu composite at 600 °C. (a) HRTEM images of the sample at different stages of tensile deformation. (b) Total charge density distribution maps of the top views perpendicular to the (1
01)WC/(110)W, (10
0)WC/(200)Cu and (110)W/(111)Cu interfaces as determined by first-principles calculation. Each region labeled W, Cu or C represents an atom and the interfaces are indicated by the yellow dashed lines. (c) Electrostatic potential distributions across the interfaces as determined by first-principles calculation. (For interpretation of the references to color in this figure legend, the reader is referred to the Web version of this article.)
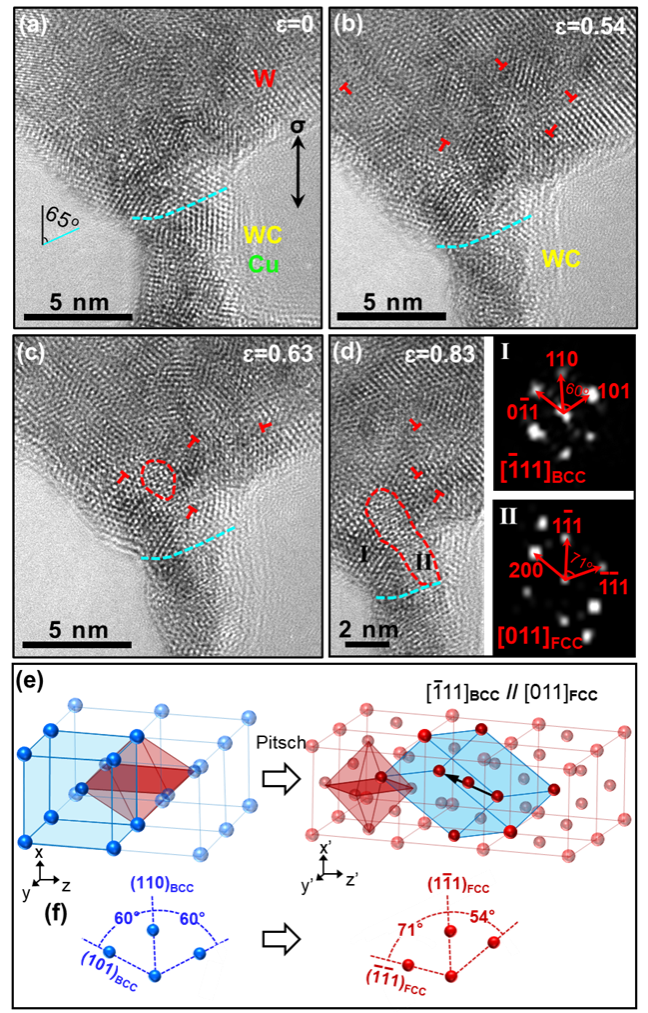
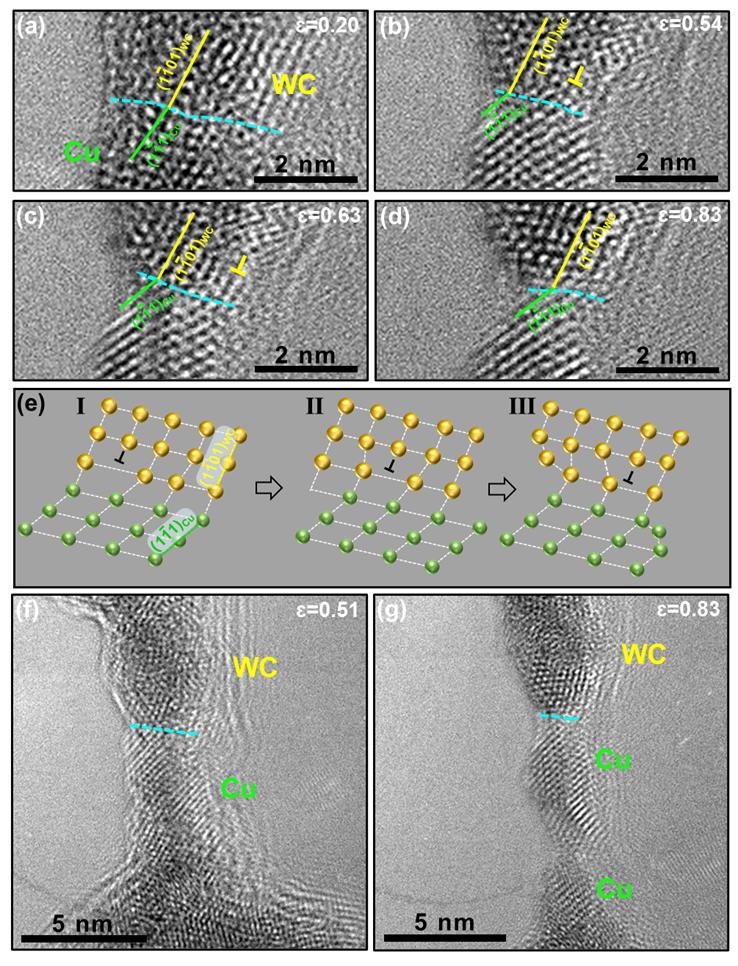
Fig. 6. Atomic-scale in-situ TEM observation of the influence of WC/Cu interface on the deformation behavior of a Cu grain within the in-situ W-WC-Cu composite at 600 °C. (a) High resolution TEM image of the sample at 0.2 strain. (b) High resolution TEM image of the sample at 0.54 strain. (c) High resolution TEM image of the sample at 0.63 strain. (d) High resolution TEM image of the sample at 0.83 strain. (e) Schematic illustration of the process of dislocation gliding process in the WC. (f) High-resolution TEM image of the WC/Cu bi-crystal sample at 0.51 global strain. (g) High-resolution TEM image of the sample after fracture.