Calculating the Curie temperature of rare-earth permanent magnetic materials has remained a big theoretical challenge. In this study, based on a home-built Sm-Co-based alloys database, a data-driven machine learning approach was developed to predict the Curie temperature of Sm-Co-based alloys. High-throughput predictions of Curie temperature were achieved using a genetic program based symbolic regression model. A classification model based on logistic regression was established to quantify the effect of doping on the Curie temperature of Sm-Co-based alloys. The key physical descriptor affecting Curie temperature was extracted from the established machine learning models, and the Curie temperature sensitivity coefficient was defined. It was discovered that the doping elements with large electrical conductivity and similar heat of fusion to that of Sm are likely to increase the Curie temperature of Sm-Co-based alloys. The model predictions were verified quantitatively by the experimental results of a series of prepared Sm-Co-based samples. This work provides a high-efficiency method for developing Sm-Co-based permanent magnets with high Curie temperatures.
Publication:https://doi.org/10.1016/j.actamat.2024.120026

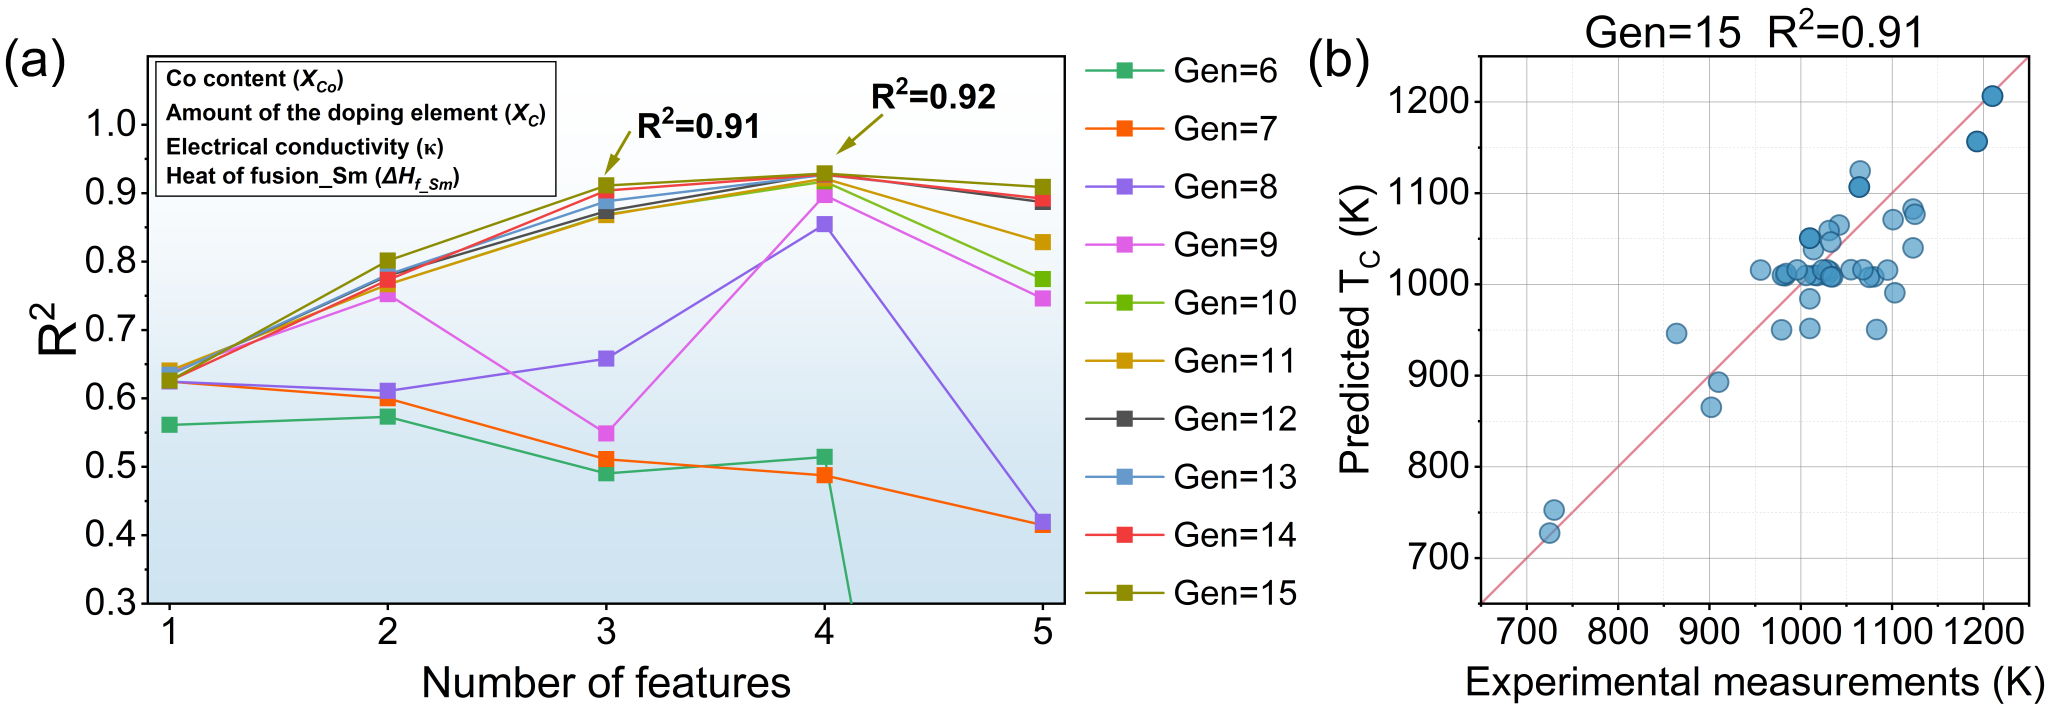
Fig. 1. Key features selection and predictions of the GP-SR model. (a) Accuracy of the symbolic regression results corresponding to the best performing feature subsets at Gen = 6∼15; (b) Comparison between the predictions and the experimental results at n = 3 and Gen=15, where n is the number of features.

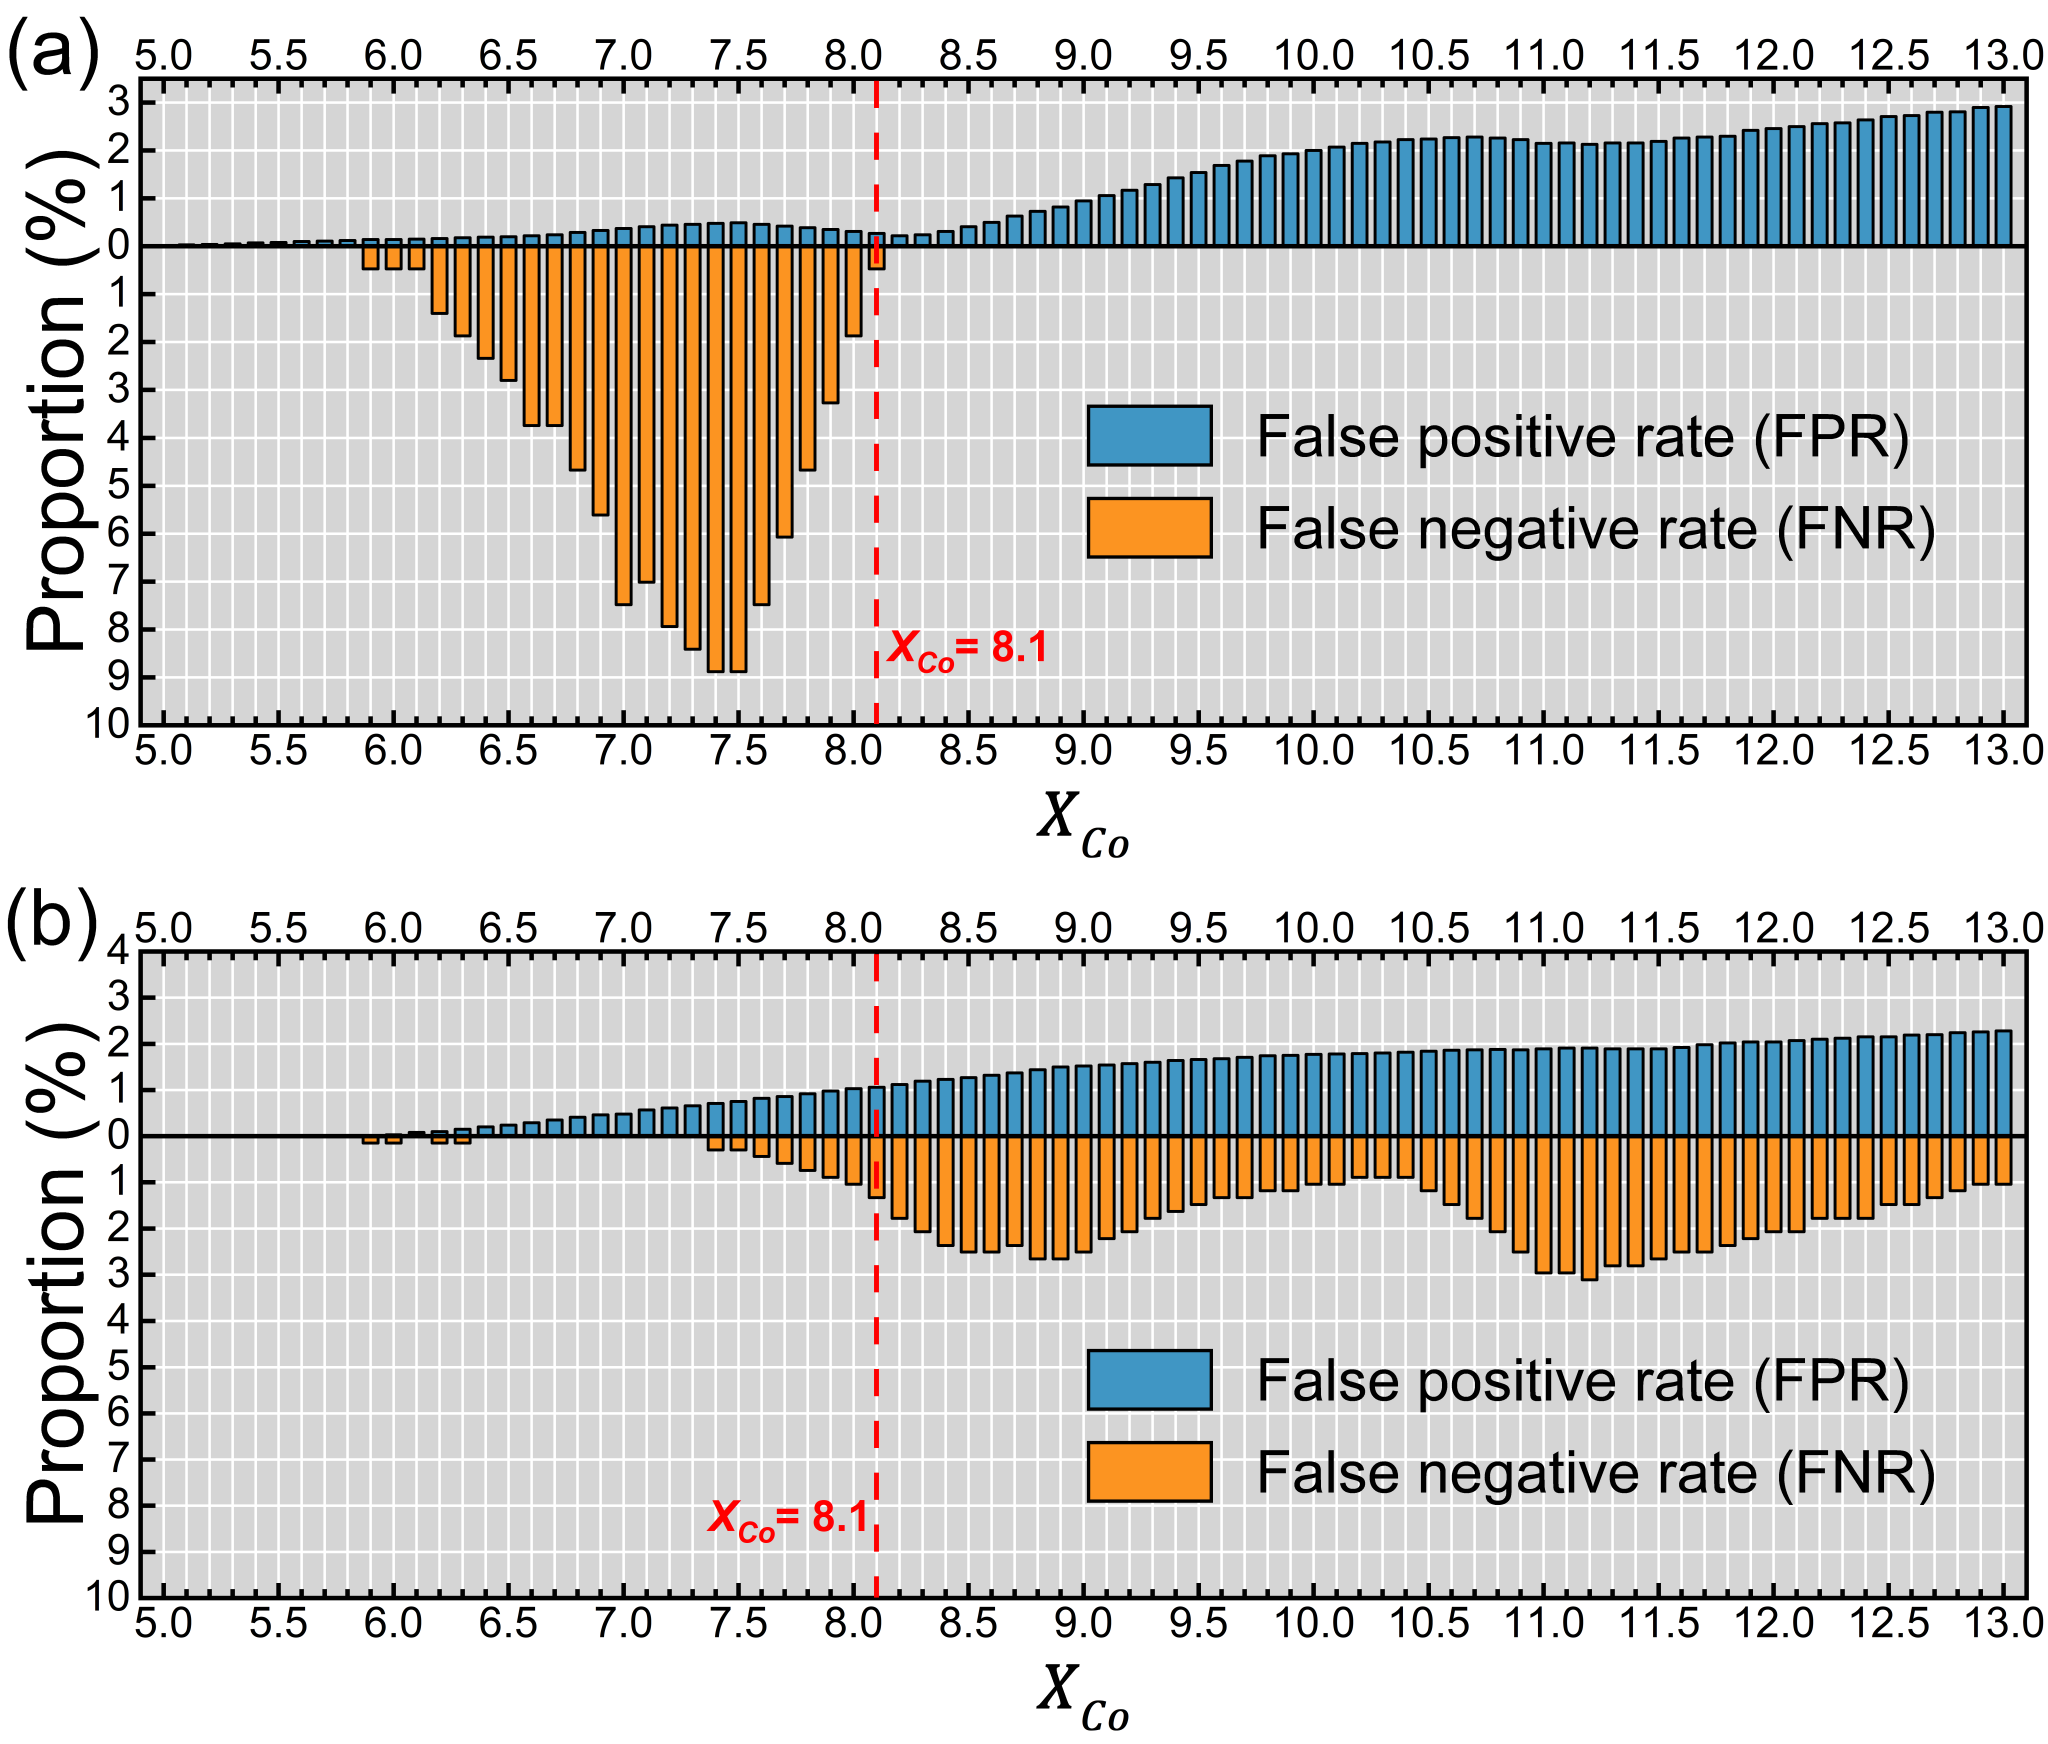
Fig. 2. Segmented statistics of LR model prediction errors according to Co content in the Sm-Co-based alloys. (a) The FPR and FNR of the LR model in a broad range of Co content; (b) The FPR and FNR of the modified LR model in a broad range of Co content.

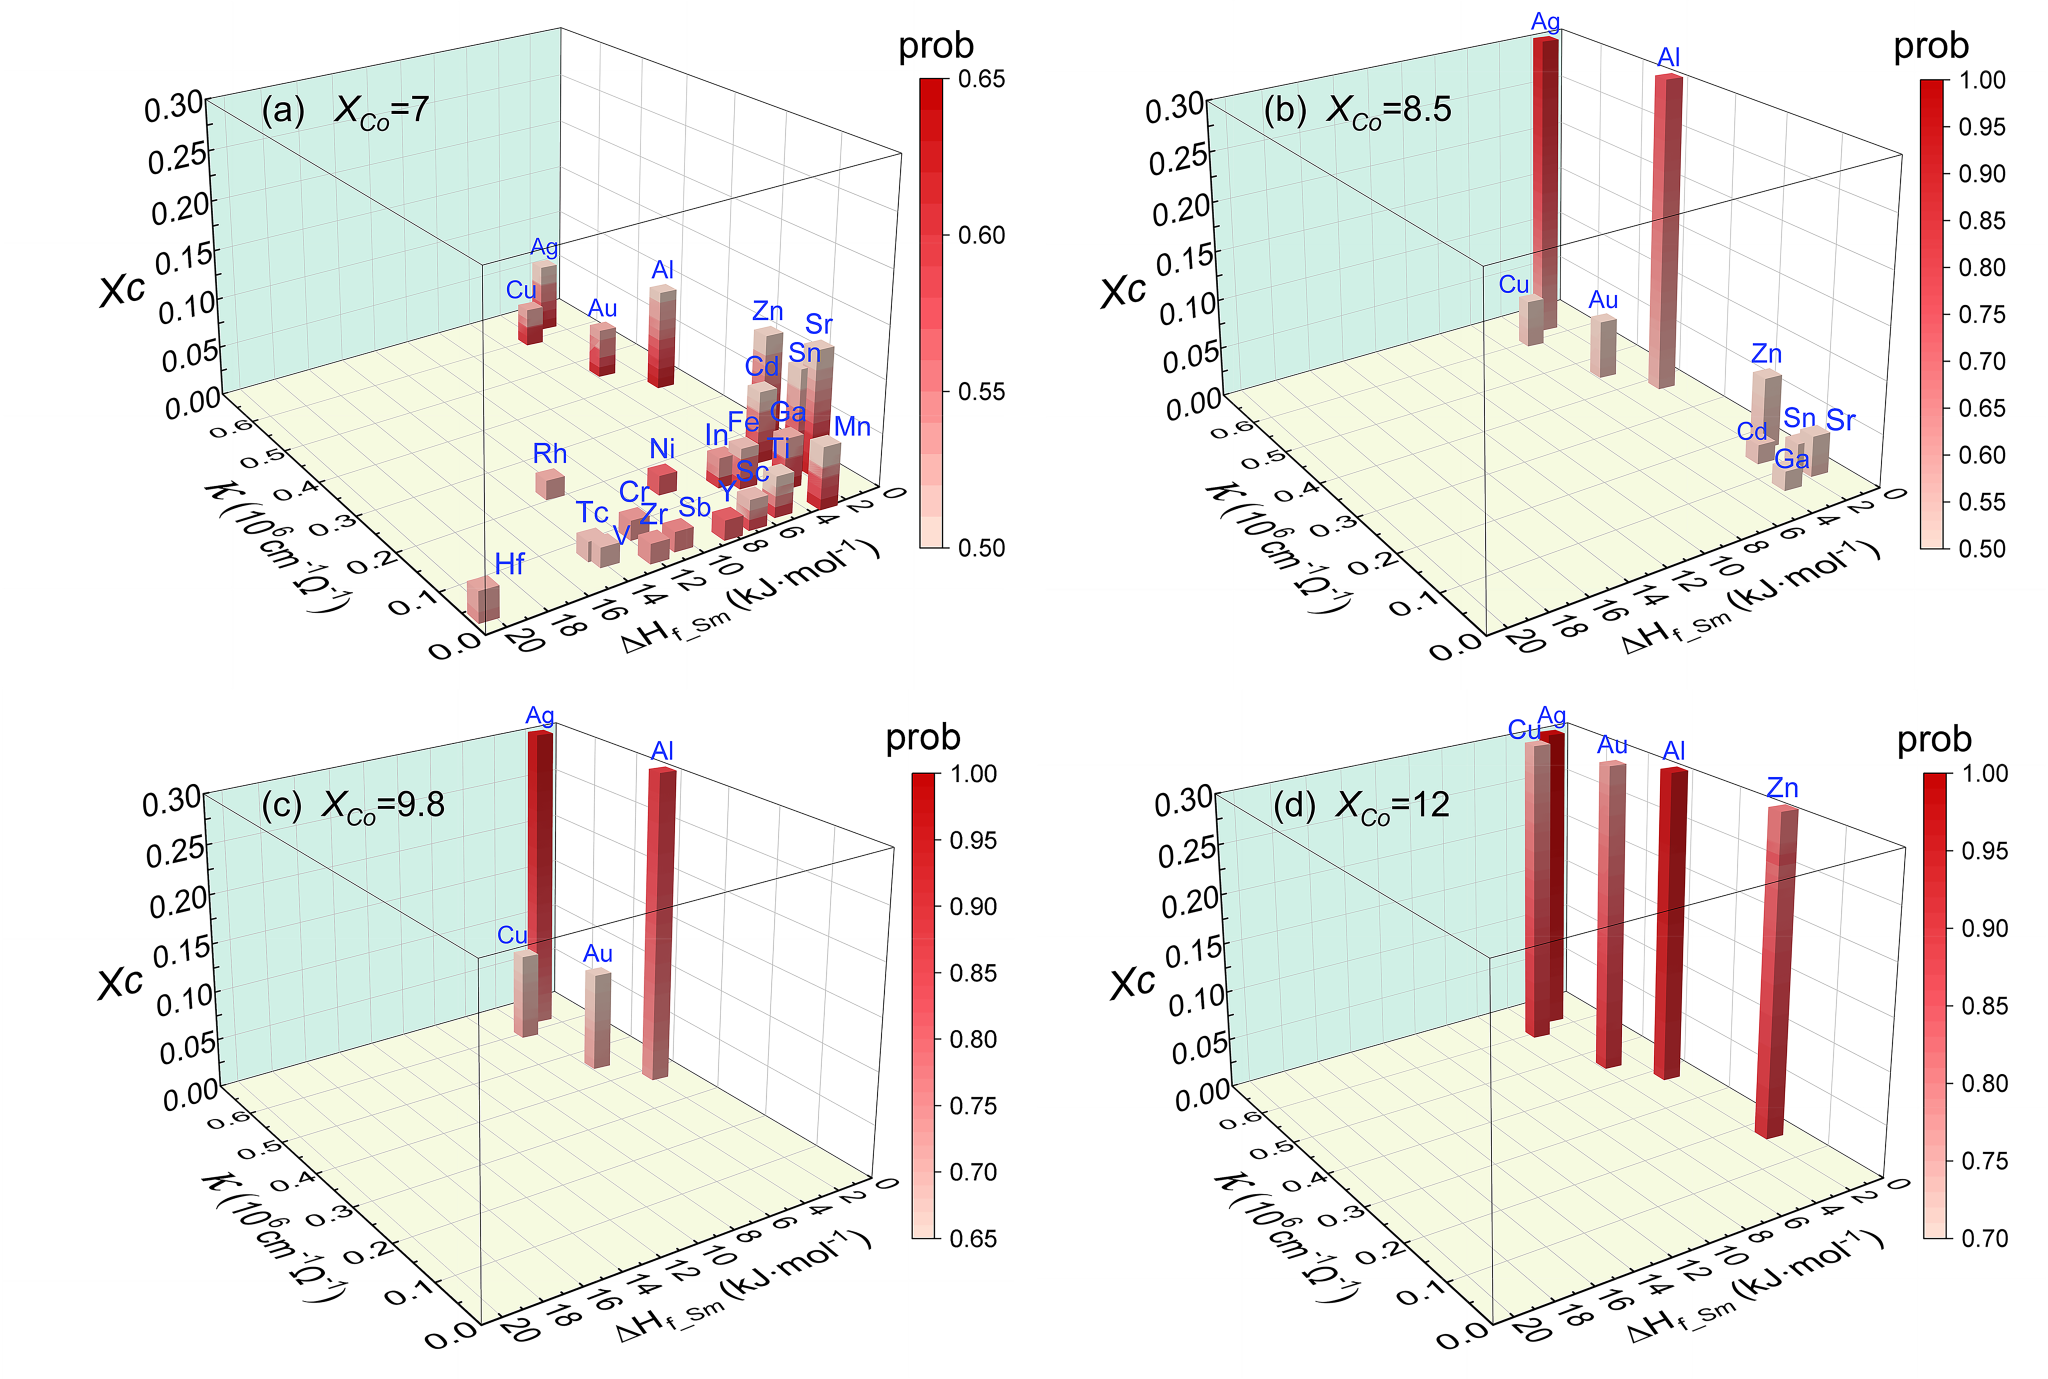
Fig. 3. The predicted possible TC increase of Sm-Co-based alloys with appropriate doping elements (featured by the electrical conductivity (κ) and the difference of the heat of fusion between the doping element and Sm (ΔHf_Sm
)) and permissible doping amounts (Xc
), using typical Co contents of
Xco= 7 (a), Xco=
8.5 (b), Xco
= 9.8 (c) and Xco= 12 (d) as examples.

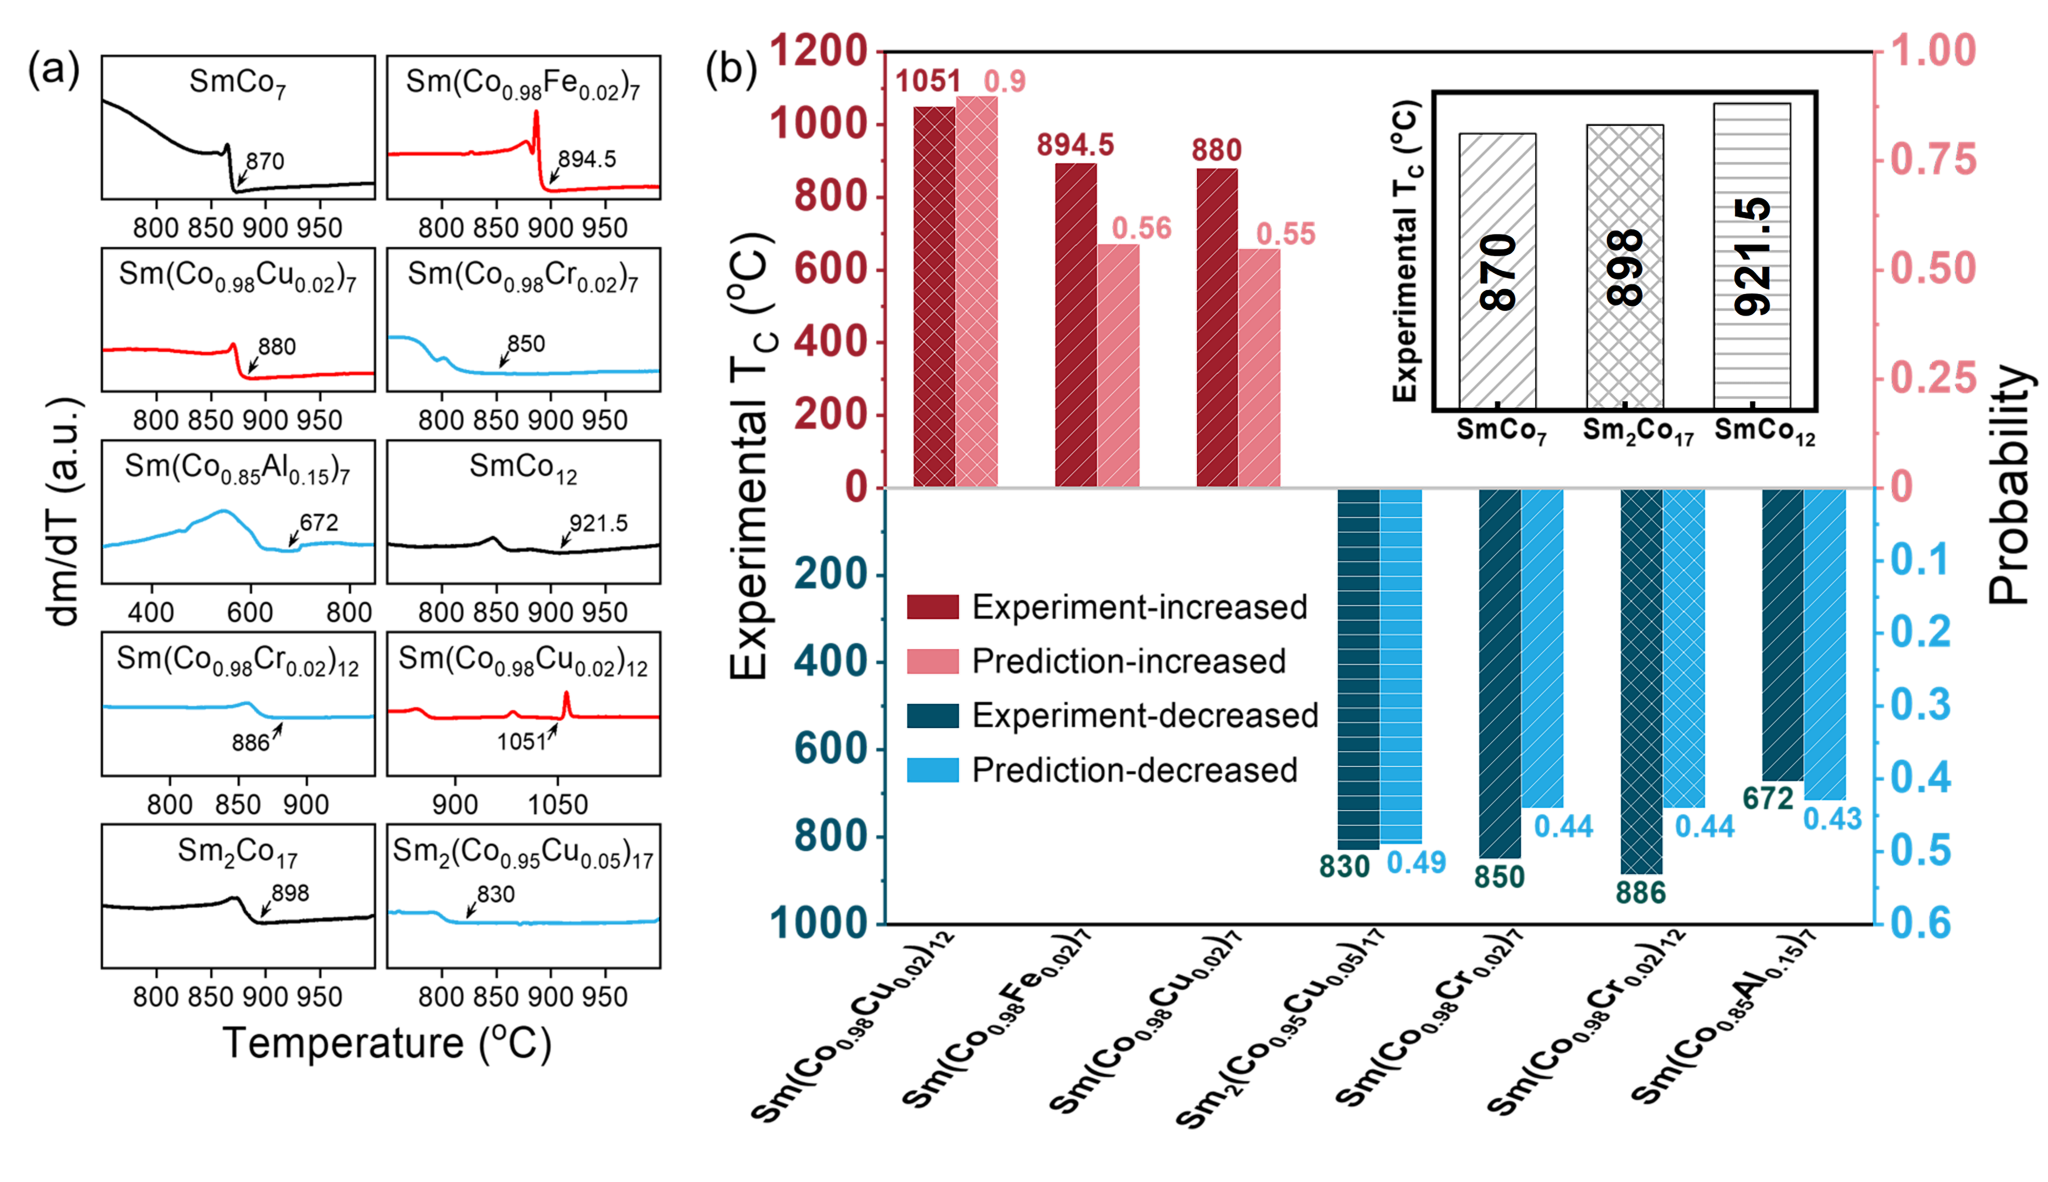
Fig. 4. Comparison of TC of different Sm-Co-based alloys obtained from experimental measurements and the LR model predictions. (a) DTG curves of the Sm-Co-based alloys prepared in experiments. Red is for samples with increasing TC, blue is for samples with decreasing TC, and black is for Sm-Co alloys without doping. (b) The TC values from experimental measurements and from the model predictions. The red bars represent the experimentally measured TC-increased samples, and the dark blue bars represent the experimentally measured TC-decreased samples. The pink and light blue bars represent the increase and decrease in the TC from the model predictions. The different patterns of the bars indicate different Sm-Co-based alloys. (For interpretation of the references to colour in this figure legend, the reader is referred to the web version of this article.)