W–Cu composites have been widely applied in numerous critical applications due to their excellent comprehensive properties. However, the mechanical properties and physical properties of W–Cu composites can hardly be enhanced simultaneously. In this paper, multilayered W–Cu composites with various copper contents were fabricated by the electric field assisted fast hot-pressing technology. The prepared multilayered W–Cu composites demonstrate simultaneous enhancement in compressive yield strength, electrical conductivity, and wear resistance compared to those of the commercial counterparts. The improved strength can be attributed to both the enhanced stress partitioning and the exceptional strength of the tungsten layer. The combined lower friction coefficient and high strength of the composites contribute to the reduced wear rate. Moreover, the in-situ compression test reveals that the plastic strain of the multilayered W–Cu composites is primarily governed by the nucleation of kinking band, which differs it from the nanolaminated composites where plastic strain is also contributed by the propagation of kinking band. This work reveals the advantages of the multilayered structure and provides new insight for the structural design of high-performance W–Cu composites.
Publication:https://doi.org/10.1016/j.compositesb.2024.111641
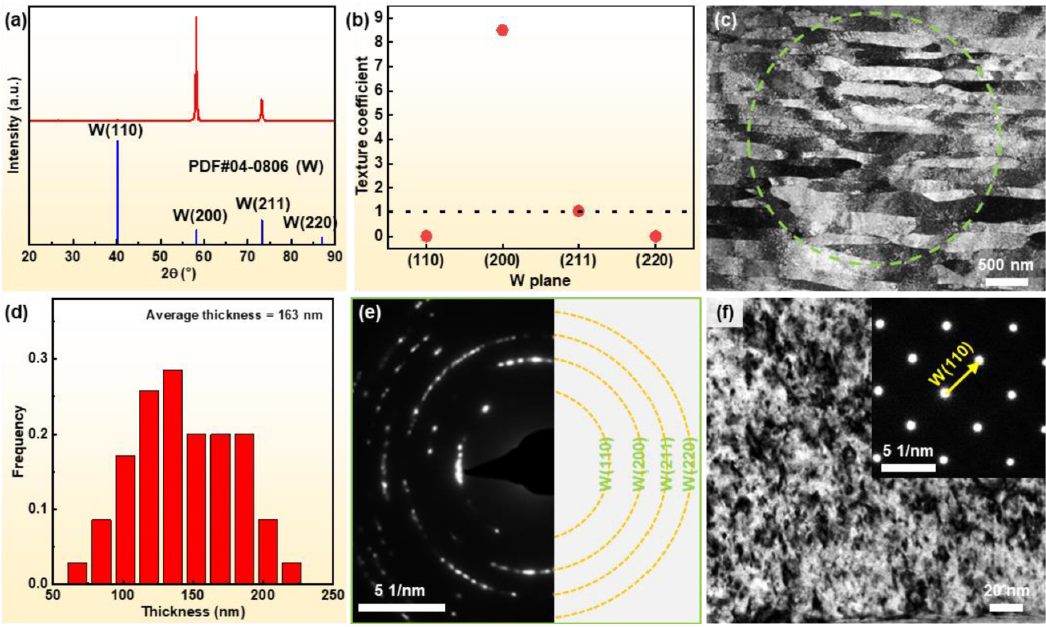
Fig. 1. (a) XRD pattern of the tungsten foil. (b) Texture coefficients of different crystal planes of tungsten foil. (c) Sectional TEM image of the tungsten foil. (d) Thickness distribution of tungsten grains within tungsten foil. (e) SAED pattern of the marked area in (c). (f) High magnification TEM image showing high-density dislocations within tungsten grains, inset is the corresponding SAED pattern.
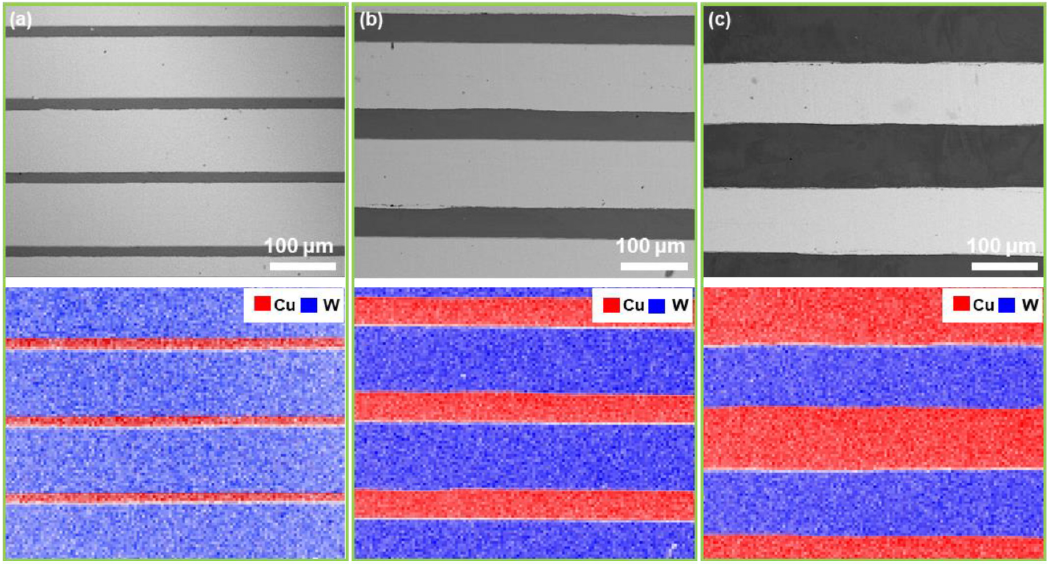
Fig. 2. SEM morphology and corresponding elemental distribution of ML10 (a), ML20 (b) and ML30 (c).
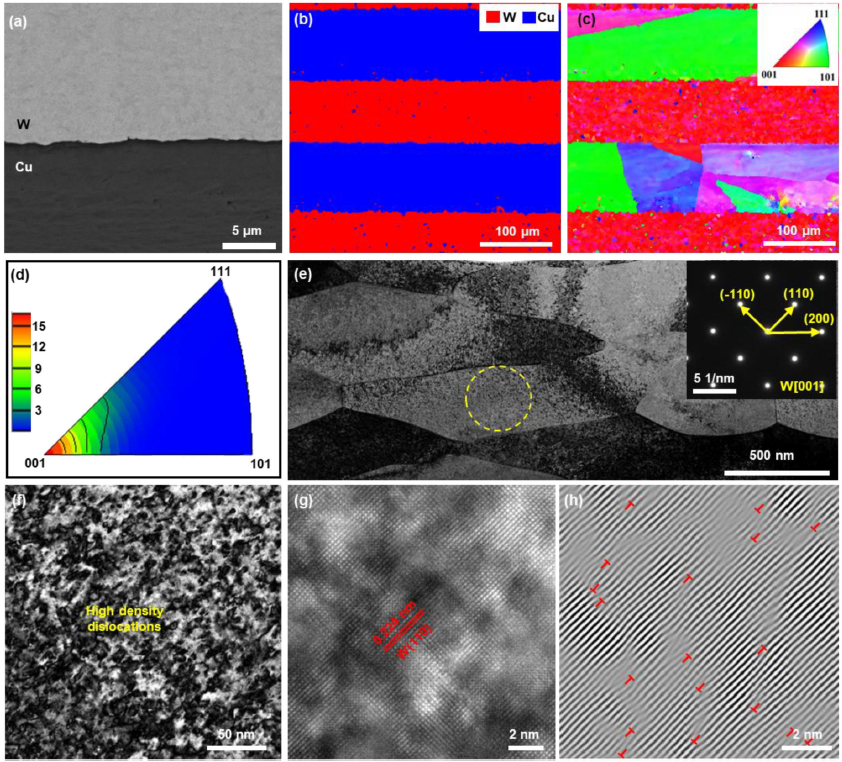
Fig. 3. Sectional microstructures of the ML30 composite. (a) SEM image of the W/Cu phase interface. EBSD analysis of phase distribution (b), crystal orientation towards ND of tungsten and copper (c), and inverse pole figure towards ND (d). (e) TEM image of the tungsten phase within the composite, inset is the SAED pattern of the marked area. (f) High magnification TEM image. high-resolution TEM image (g) and the inverse fast Fourier transformation pattern (h) showing high-density dislocations within tungsten grains.
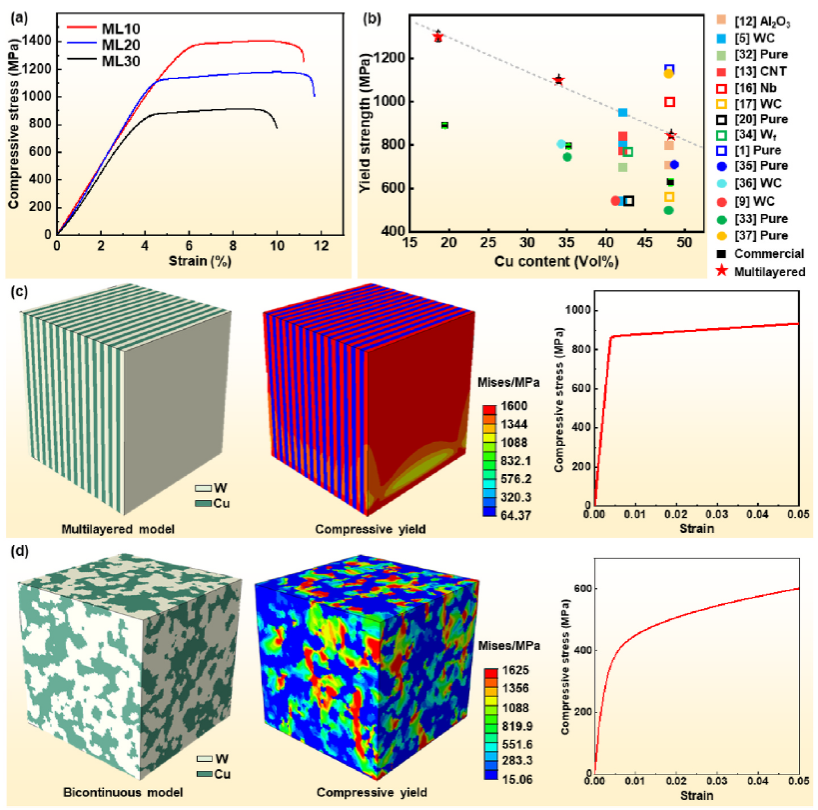
Fig. 4. (a) Room-temperature compressive stress-strain curves of multilayered W–Cu composites. (b) Comparison of the compressive yield strength of multilayered W–Cu composites with that of the commercial W–Cu composites. The initial model, mises stress distribution at compressive yield and simulated stress-strain curve of (c) multilayered W–Cu and (d) bicontinuous W–Cu.
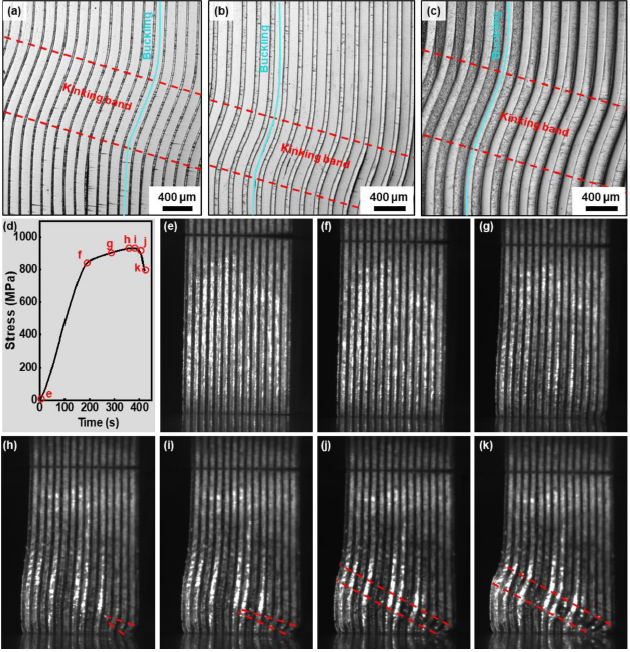
Fig. 5. Sectional SEM morphology of the failed ML10 composite (a), ML20 composite (b) and ML30 composite (c). (d) Stress-time curve during the in-situ compression. (e–k) Macrostructure photos of the compressed sample with different strains.
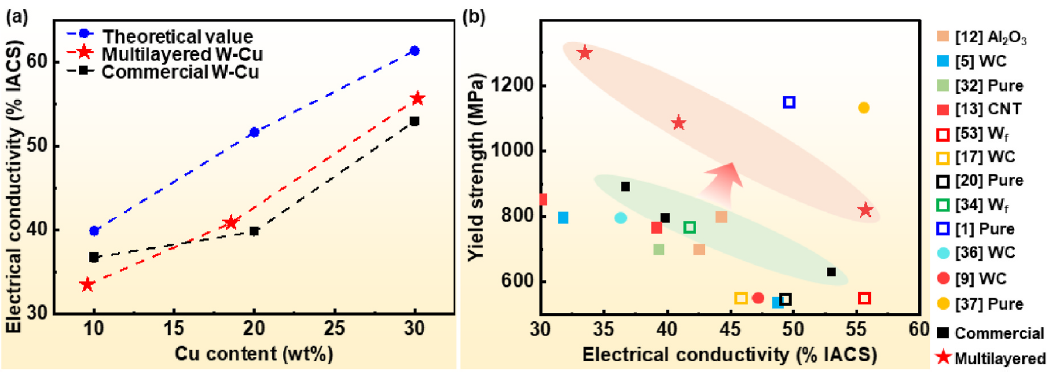
Fig. 6. (a) EC of the multilayered W–Cu composites and commercial W–Cu composites. (b) Compressive yield strength versus EC of multilayered W–Cu and other W–Cu composites in the literature.
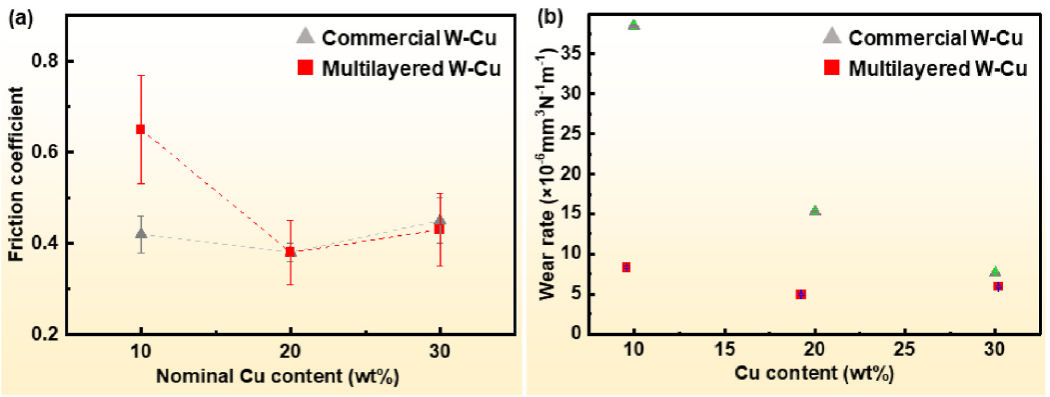
Fig. 7. Friction coefficients (a) and wear rates (b) of the multilayered W–Cu composites and commercial W–Cu composites.
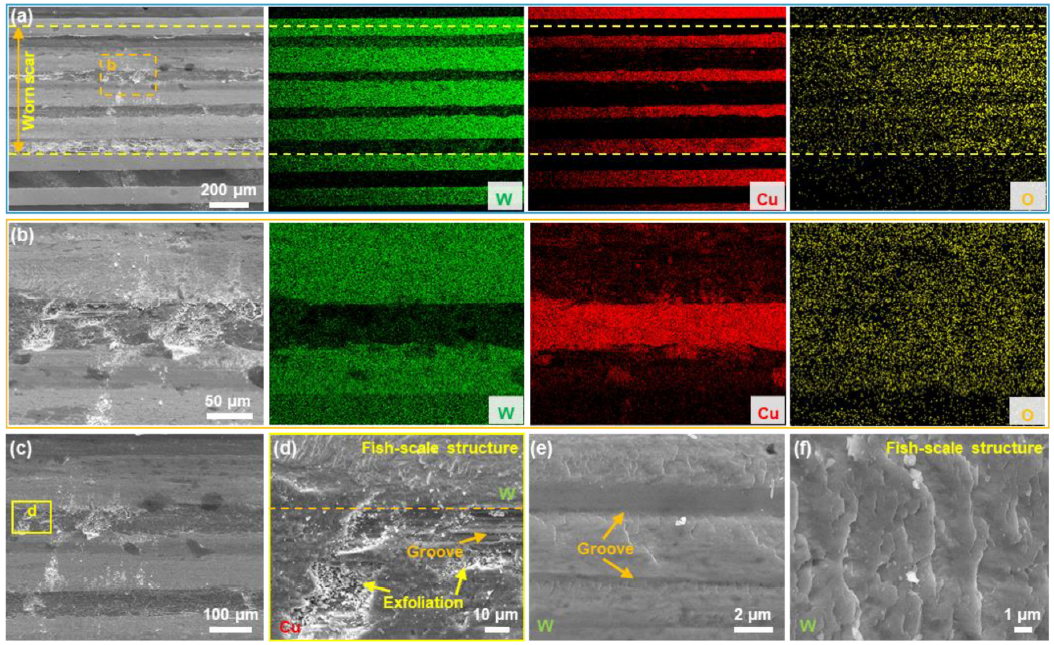
Fig. 8. (a, b) Worn surface morphologies with different magnifications of ML30 composite and the corresponding elemental distributions. (c) A typical worn surface morphology of the ML30 composite. (d) Enlarged view of the copper phase where exfoliation and grooves were found. (e, f) Enlarged view of the tungsten phase where the grooves and fish-scale structure were identified.
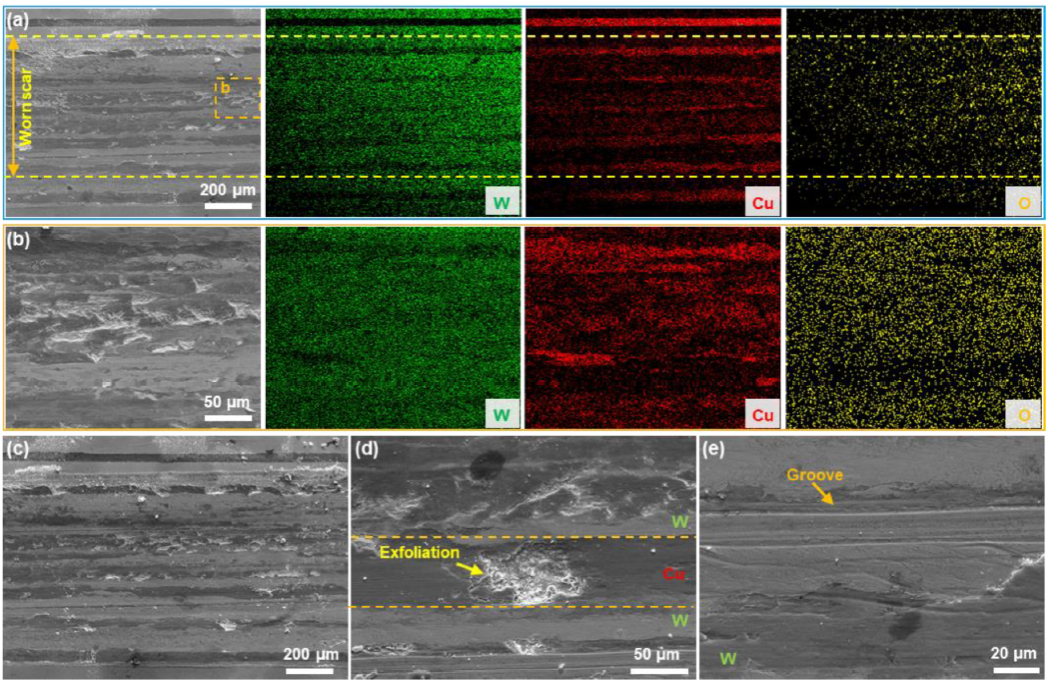
Fig. 9. (a, b) Worn surface morphologies with different magnifications of ML20 composite and the corresponding elemental distributions. (c) A typical worn surface morphology of the ML20 composite. (d) Enlarged view of the copper phase where exfoliation was found. (e) Enlarged view of the tungsten phase where the shallow grooves were identified.
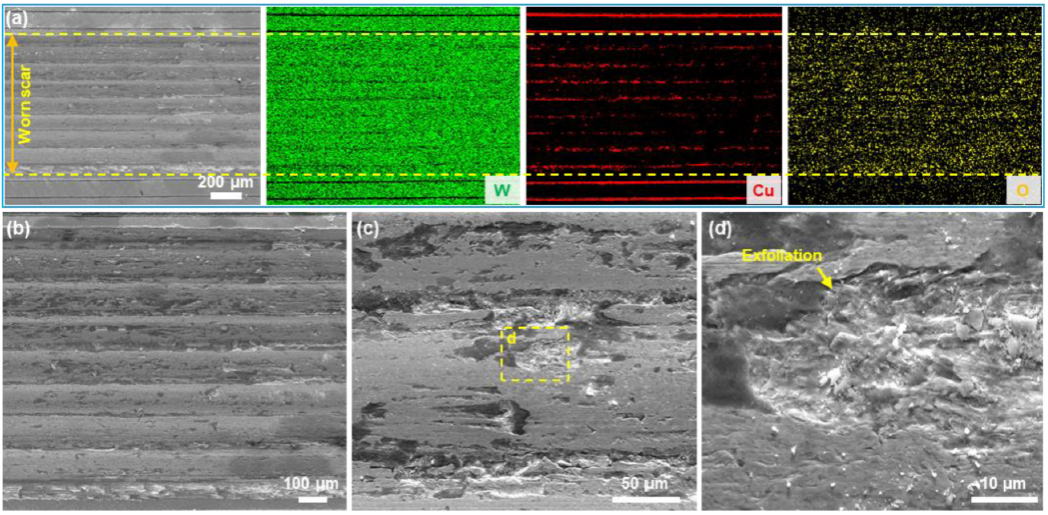
Fig. 10. (a) Worn surface morphologies with different magnifications of ML10 composite and the corresponding elemental distributions. (b) A typical worn surface morphology of the ML10 composite. (b, c) Enlarged view of the tungsten phase where severe exfoliation was identified.
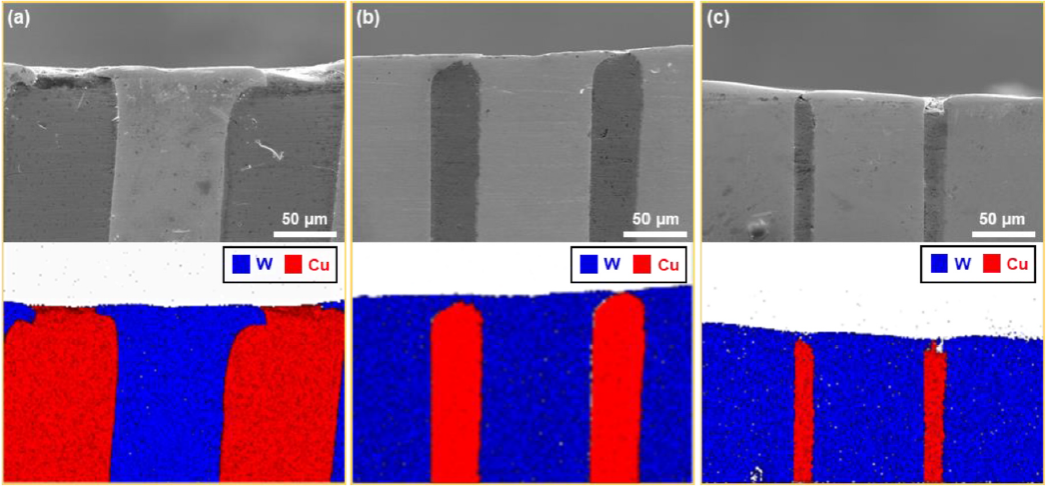
Fig. 11. Sectional morphologies under the worn tracks of ML30 (a), ML20 (b) and ML10 (c) and the corresponding elemental distributions.

Fig. 12. (a) Finite element model for the simulation of wear process. Mises stress distributions on the surface (b) and on the cross-section (c) of the worn composite. (d) Displacement distribution on the surface of the worn composite.
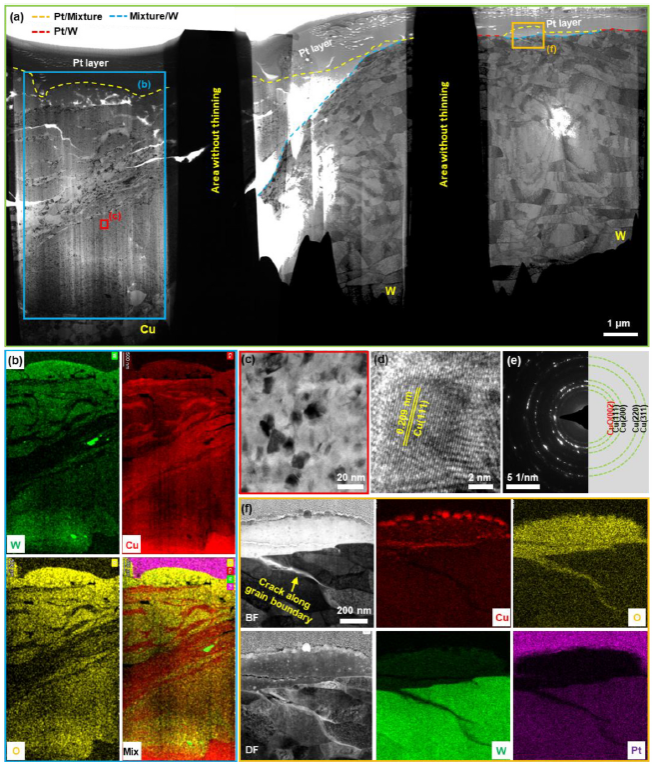
Fig. 13. (a) Finite element model for the simulation of wear process. Mises stress distributions on the surface (b) and on the cross-section (c) of the worn composite. (d) Displacement distribution on the surface of the worn composite.

Fig. 14. Schematic diagram depicting the wear process of the multilayered W–Cu composites. (a) Unworn structure, (b) deformation of tungsten and bulging of copper, (c) formation of nanograins beneath the worn surface and some copper distribute on the surface of tungsten layers, (d) surface oxidation and steady wear.